Blog

  • Search Influence Hits a Grand Slam with 4 New Hires

    Search Influence hits it out of the park with FOUR new additions to the team! Let’s hear the new additions to the line-up. 


    Collin Guedon, Digital Copy Editor

    A Greater New Orleans Area native (specifically, Abita Springs), Collin didn’t venture far for college, attending Louisiana State University. Graduating with a bachelor’s degree in Digital Advertising and Visual Communication, he specializes in copywriting and creative writing. Colin’s favorite part of digital marketing is when creativity meets science and when he sees something he created have real-world results.

    When he’s not copywriting or copyediting, you can find Collin on the golf course, grilling with friends, or binge-watching the latest movies and television shows. 


    Madison Horst, Account Manager

    Madison hails from the Northshore of Lake Pontchartrain (specifically, Madisonville), and graduated from Louisiana State University with a bachelor’s degree in Marketing. She brings several years of sales and relationship-building experience to Search Influence and looks forward to bringing creative approaches to help clients achieve their goals.

    When Madison’s not strategizing on client campaigns, you can find her teaching fitness classes, taste testing the newest local brewery and food truck, or listening to true crime podcasts. 


    Victoria Mayfield, Digital Advertising Coordinator

    Growing up down the street from Princeton in New Jersey, Victoria made her way to New Orleans to attend Loyola University New Orleans where she graduated with her bachelor’s degree. Victoria’s digital marketing passion developed while interning at marketing agencies during college. She loves seeing the results of the work after the project comes together. 

    When not strategizing or analyzing data, you can find Victoria trying out new restaurants, taking a yoga or pilates class, checking out the newest movies, or enjoying the great outdoors.   


    Lindsey Schultz, Digital Advertising Coordinator. 

    A transplant from Parkland, Florida, Lindsey moved to New Orleans to attend Tulane University where she graduated with a bachelor’s degree in Marketing. Formerly a Communications Strategist for a media company, Lindsey has a passion for innovative digital strategy and copywriting.

    When not at work, you can find Lindsey dancing, crotcheting, or hanging out with her two adorable rabbits.


    Welcome to Search Influence, Collin, Madison, Victoria, and Lindsey!


    Interested in joining our team? Check out our open positions!


  • How Your Website’s Speed Can Impact Your Institution’s Recruitment Goal

    Key Insights

    • Site speed is a key ranking factor—even more so with Google’s Core Web Vitals rollout.
    • Data suggests lower load times leads to a drop in overall conversions.
    • You can consistently monitor site speed with free tools.

    According to previous Google data, users tend to abandon a loading site after just three seconds of waiting. This means your institution needs a fast, reliable website.

    However, beyond the user experience, inadequate site speed can negatively impact rankings. Ever since Google announced that site speed was a ranking factor, the need to consistently monitor and improve site speed has increased tremendously.

    Through continuous improvement to site speed, you may see a positive impact on rankings, thus getting your programs, degrees, and other content in front of more potential students. We recommend having all important elements on-site load under that three-second mark to help with your rankings.

    This blog post will help you understand why site speed impacts rankings and conversions and explain a site speed audit and how your institution could get started with one.

    Graphic of loading web browser

    Does Site Speed Impact Rankings?

    Google has used site speed as a ranking factor for desktops since 2010 and for mobile searches since July 2018. Users performed around 61% of searches on a mobile device in 2021, making it essential that your site is quick on mobile moving forward.

    It is hard to benchmark just how much site speed impacts rankings because it is just one of around 200 ranking factors Google may consider when indexing your site. However, it stands to reason that if your competitors offer comparable content on a faster site, Google and users may reward that site with more traffic, less bounce rate, and more time on-page.

    Overly large images often impact site speed. Just like your computer takes longer to open a large image file, your browser has to execute a similar process. By not compressing these images, you unnecessarily add a lot of load time to the site, thus adding a negative ranking factor.

    Site Speed, User Experience, and Engagement

    A negative site speed experience will directly impact your site’s ability to hold traffic and to prevent other competitors from stealing that traffic.

    There is a direct correlation between load times and bounce rates. After 10 seconds of load time, there is a 123% increase in bounce rate versus a site that loads in one second.

    Graph of relationship between bounce rate and website load times

    In May 2020, Google introduced Core Web Vitals, which measures what Google considers essential in a website/user experience: largest contentful paint, first input delay, and cumulative layout shift.

    Without getting too technical, these measurements essentially tell you how quickly your site is usable. The longer the load times on these components, the longer it takes for the site to be usable, contributing to higher bounce rates and less interaction on site.

    Does Site Speed Impact Conversions?

    Similar to user experience, if visitors find that the load times and site speed are inadequate, they are less likely to engage with conversion forms. Data suggests that one second in added load times leads to a 7% drop in conversions. If the goal is to drive more students to a program or degree, slow load times may have a tangible impact on the amount of form fills you receive.

    Key Factors of a Site Speed Audit

    There are so many factors that contribute to a site’s overall speed, but some are fairly common and relatively easy to address compared to more involved technical development fixes. First and foremost, you will want to evaluate your site on desktop and mobile. Nearly any site speed tool you utilize will delineate between the two versions of the site. Some of the more common issues include:

    • Unused / excessive JavaScript or CSS: Many sites have scripts, plugins, and other script-dependent items in their coding that bog down crawlers and site load times.
    • Oversized images: Frequently sites fail to minimize or compress their images, resulting in large file sizes and longer load times.
    • Poor coding: Any broken coding or missing elements can add to a browser’s difficulty in loading a site.

    Beyond these fixes, there are plenty more ways to positively impact site speed; however, it is important to note that many of them require a large amount of technical development work. As a result, some fixes are not attainable without essentially a complete redesign of the site. However, anything that will improve site speed will lead to a higher chance of a conversion.

    Free Tools for Site Speed Testing

    Several tools can help you regularly monitor your site speed and discover errors (for free!)

    Page Speed Insights: This is Google’s tool for testing page speed insights. The report contains more information on the technical items and potential fixes. This report is beneficial for evaluating the Core Web Vitals elements.

    Pingdom: With this tool, you can more easily break down individual loading elements of a site such as images, JavaScript, CSS, etc.

    Example of Pingdom site speed test results

    WebPageTest: Similar to Pingdom, this is a great tool for a technical breakdown of your site speed. You can also customize your location to test site speed from different locations and different browser and device types. Perhaps most helpful – you can run a Core Web Vitals test.

    Regardless of the tools you use, you should monitor site speed consistently. Google has introduced new elements to its ranking algorithms over the past few years that indicate that user experience, of which site speed is critical, will continue to be an important ranking factor. If your institution’s site speed is lagging behind competitors, there is a good chance you are losing out on potential students, or at the very least, missing more conversion opportunities.

    Concerned about your institution’s site speed? Contact Search Influence today for a consultation.

  • Read This Before You Switch to Google Analytics 4

    Read This Before You Switch to Google Analytics 4

    Key Insights

    • A new version of Google Analytics is available and comes with some major changes.
    • The Google Analytics 4 release is the largest update in the last decade or more to Google Analytics. It impacts the way users are tracked and the way their behavior is reported to us as marketers.
    • Google hopes to future proof and improve user analytics by updating to tracking technology that doesn’t rely on browser cookies.
    • Google Analytics 4 includes changes to both reporting and measurement – which are currently still a work-in-progress, by our assessment.

    Google Analytics data being displayed on a tablet

    There’s no doubt 2020 was a whirlwind for many reasons. Adding to the chaos for digital marketers everywhere, Google snuck in a major update for Google Analytics, with the official rollout of Google Analytics 4 (GA4) in late 2020.

    Chances are, you probably depend on Google Analytics to understand your website traffic and user experience, track your digital campaigns and make decisions. W3 Techs reports that Google Analytics is used by “86.1% of all the websites whose traffic analysis tool we know.” So, major updates to Google Analytics naturally have sweeping impacts for marketers. Adapting (or not) to the new technology could impact your long-term ability to analyze the success of your marketing.

    Google rolls out updates and changes to Google Analytics over time, and in some cases, users continue to track their data with past versions. The GA4 release is the largest update in the last decade or more to Google Analytics. It impacts the way users are tracked and the way their behavior is reported to us as marketers.

    We expect websites will be forced into switching at some point. That said, there are considerations to adopting early. On one hand, it’s recommended to begin collecting data via the new technology so that when you are required to switch, your historical data is built out. On the other hand, you don’t want to solely rely on GA4 just yet. This post will review what makes GA4 notable and provide some guidance (in layman’s terms) on whether or not you need to consider switching.

    If you’re a developer or looking for a more in-depth technical perspective, check out “Should You Switch To Google Analytics 4” by my colleague David, our resident conversion tracking authority.

    What is Google Analytics 4?

    Google Analytics 4 is effectively an entirely new form of Google Analytics which makes “App + Web” configuration standard for all online properties. The foundational metric of reporting has changed from Pageviews within a Session to Events. This means it’s better designed for those who have both an app and website and who want to more seamlessly track and understand individual behavior across those platforms.

    How is Google Analytics 4 different from Universal Analytics? What are the key reporting differences?

    Usually, Google Analytics updates are just code updates in the background and no change to the reporting user interface. But this update is significantly different.

    There are some benefits to the reporting changes, but since GA4 is still a work-in-progress, there are some significant differences that may present challenges to the typical Universal Analytics user. Bounteous covers them in-depth here. Here are a few key points:

    • Reporting dashboard differences
      • No e-commerce reports
      • No available cost data from ads
      • Marketing channels are associated with conversion events rather than visitor sessions
    • Currently, there are very few pre-built reports, filters, and views. For example, you cannot exclude internal traffic.

    Should I switch to Google Analytics 4?

    The short answer to “Should I switch to Google Analytics 4?” is… maybe. The answer depends largely on what type of web/app properties you have and want to track, among other considerations. Keep in mind that the analytics community as a whole expects there could be significant progress and updates to GA4 as time goes on. GA4 will eventually replace Universal Analytics as the standard, so it is appropriate to be paying attention and considering how you may transition.

    So what are the considerations for switching to GA4 now? Here are the things you should consider:

    • Do you have a website and an app?
    • How dependent are you on your current Analytics reporting metrics and data?
    • Do you have the bandwidth to manage the switch, learn and understand the differences in reporting metrics and rework existing reports?
    • Do you work with an outside agency or other third parties on marketing efforts? What do they recommend?
    • Do you use any other application to tie into Google Analytics (like Google Data Studio or a custom reporting dashboard)? If yes, are you prepared to update those connections?

    Our recommendations for switching to GA4 now:

    • If you only need to track behavior on a website (not an app), the short-term benefits of transitioning to GA seem insignificant and will likely demand a lot of resources to adjust to the new configurations, reporting, etc.
    • If you want to unify reporting and improve tracking across apps and websites you manage, some of the immediate benefits may make the transition worth your while.

    Regardless of which boat you are in, we recommend to track Universal Analytics properties and GA4 properties concurrently for now.

    Using a tablet to evaluate Google Analytics data

    Can I use both Google Analytics 4 and Universal Analytics?

    Yes, you can use both Google Analytics 4 and Universal Analytics at the same time, and we recommend it as the immediate option to set you up for a long-term successful transition.

    If it excites you to adopt “the new thing” but want to play things safe, you can install both tracking codes and check out the differences yourself. Since these are separate properties, they don’t interfere with one another, and per our testing, we can set up both to work simultaneously without any conflicts.

    An important note is that historical data from Universal Analytics will not be available in Google Analytics 4, so you might consider installing it alongside Universal Analytics to begin to collect data in the new landscape.

    For more information about running GA4 and Universal Analytics parallel, check out this blog written by our CEO Will Scott

    Do I Have to Switch Now?

    If you walk away with nothing else, here’s what I hope you gained from reading this post:

    • It’s new, it’s developing, and we’ll be watching along the way. It’s generally expected that Google will continue to iterate and improve on GA4 in the upcoming year.
    • If your goal is to track both an app and website, an early adoption plan for GA4 is a good idea to explore.
    • You don’t have to switch yet! There’s no risk in setting up GA4 to work concurrently with Universal Analytics and begin collecting data so that you are ready in the future for a transition. In fact, we recommend it.

    Do you want advice specific to your situation on Google Analytics 4 or any other tracking and analytics challenges? Reach out to our expert team at Search Influence through our site form and let’s discuss how we can help you begin tracking your website performance accurately!

  • What is OTT and CTV? A Marketing Manager’s Guide to Advertising on Long-Form Streaming

    Key Insights

    • Consumers across all age groups have embraced streaming tv shows and movies.
    • Advertising on streaming services offers many benefits over traditional TV advertising, including robust targeting and measurement, including individual or household information.
    • By leveraging OTT, you can reach consumers with messages across multiple devices and platforms, truly running a full-funnel campaign with ads that talk to each other.
    • You can stretch your advertising dollars with OTT to reach consumers where they already watch content: their smart TVs, computers, and mobile devices.

    Even if you are old enough to remember tuning in live for the Cheers finale live or parking in front of the television for “The One Where Ross Finds Out,” chances are you now stream most of your favorite TV shows. In 2020, Hulu found that 90% of all 13–54-year-olds watch TV on a streaming platform. That’s several generations of consumers who engage with TV, movies—and brands—in a streaming environment. The COVID-19 pandemic has increased watching habits, with the average American now spending nearly two hours a day watching subscription video on demand services.

    Person using remote control on their streaming device

    Advertising on streaming television is an affordable way for businesses to fill their upper funnel while capitalizing on the creative flexibility, targeting, and measurement capabilities of digital advertising. Emerging brands can use streaming advertising to leverage the mass reach and advanced targeting capabilities of long-form streaming to help build awareness, while established businesses can use it to connect with coveted audience segments who do not engage with traditional media.

    The industry term for streaming long-form content directly to viewers via the internet through TVs or devices is called OTT. This post will further define OTT and expand on its benefits, including targeting, measurement, and branding.

    About OTT

    Defining OTT

    OTT stands for over-the-top and refers to content streamed on apps and services, such as Hulu, Discovery+, or Peacock.

    You can watch OTT content on any device connected to the internet. The term originates from the now common practice of consumers going “over the top” of a cable box, bypassing cable/satellite subscriptions or broadcast TV to stream long-form, premium video (such as scripted TV shows).

    Advertisers can also use the term OTT to distinguish streaming tv shows and movies from user-generated online video (for example, unboxing videos on YouTube made by an influencer is not OTT content.)

    What is CTV?

    CTV is a subset of OTT. CTV stands for connected television and refers to a device that delivers video by connecting to a TV.

    CTV examples:

    • HDMI sticks: Amazon Fire TV, Apple TV, Roku
    • Gaming consoles
    • Connected television sets, such as smart TVs

    It does not include tablets, computers, or other mobile devices.

    An Example of OTT and CTV

    You start binge watching the latest Hulu series of the moment through a Roku plugged into your TV.

    You streamed OTT content over CTV.

    You move to your bed and watch Hulu from the app on your phone (yes, yes, you know it’s not good for your sleep to watch TV in bed).

    You streamed OTT content.

    Benefits of OTT

    OTT combines the power of digital media with the advantages of advertising on television. Your brand receives traction from the authority consumers assign to seeing your ad on a big screen with the targeting and measurement capabilities that allow you to optimize performance to maximize your ad spend.

    With all of the research options at our fingertips, consumers’ path to conversion evolves each year. Product research and shopping takes consumers across many online and offline touchpoints. By leveraging OTT, you can reach consumers with messages across multiple devices and platforms, truly running a full-funnel campaign with ads that talk to each other.

    Today's path to conversion

    OTT Targeting Capabilities: First and Third-Party Sources

    OTT first and third-party sources enable businesses to build detailed segments beyond the typical options found on other digital marketing platforms.

    First-party data: The advertising platform learns about audiences through device-level viewer data, which it takes from users’ IP addresses. Targeting options vary by OTT provider. Some options include:

    • Location tracking and geofencing
    • Home page visits

    Third-party data: Third-party vendors provide consumer data and customer attributes that enable more precise targeting definitions. Some options for third-party data targeting include:

    • Purchase behaviors (online and offline)
    • Age/gender composition
    • TV viewership and media consumption

    Retargeting

    A prospect’s viewing behavior becomes part of their digital footprint. If a prospect views an ad, OTT’s retargeting capabilities lets you follow this prospect across all ad-supported streaming services and devices. You can capture brand impressions with video and then prompt an action on a device where it’s easy to convert.

    For example, a healthcare practice can target an upper-funnel ad promoting a new procedure to a household’s smart TV. Later, the practice can display a lower-funnel ad that encourages the prospect to fill out a form for a free consultation for this new procedure to a mobile device in that same household. A prospect is much more likely to fill out a form on a mobile device than if the ad appeared on a smart TV, encouraging prospects to go onto their website and fill out the form.

    OTT Targeting Capabilities: Addressable Geo-Fencing aka Household Targeting

    Through OTT, you can target multiple prospects under one roof.

    ​​When several devices are connected to the same router, they form a network and have the same external IP address. As a result, advertising platforms can identify multiple devices in the same household by looking at whether they have the same IP address.

    OTT advertising platforms can match a smart TV to a series of desktop and mobile devices, creating a “digital household,” which allows advertisers to target individuals across different devices. This extends the opportunity to customize your ad based on the user’s device.

    Examples of What You Can Do with OTT Targeting

    OTT’s multiple targeting options allow you to specify as much as your campaign needs.

    • If a prospect searches a website for events in their area, you can use keyword search retargeting to show them an ad for your event as they stream their favorite TV show.
    • A small business could target residents over 35 years old in a specific zip code.
    • If you want to target adults for your continuing education program, you can leverage information such as education level, areas of interest, and browsing history to customize ads down to which educational programs might be most attractive to a given prospect.

    Measurement and Attribution

    OTT’s sophisticated measurement and attribution capabilities give businesses the tools to evaluate the ROI of their campaigns and understand which segments, platforms, and content deserve further investment.

    The capability to match consumers to their devices means you can see which specific prospects watched your ad, how much they watched, and the outcomes of watching the ad (such as purchase, website visit, or store visit). With the flexibility to test audiences and content variations, you ensure your advertising remains relevant, so you don’t waste ad dollars on a consumer unlikely to take action.

    Branding

    OTT’s multiple platform options help establish legitimacy for your brand. With OTT, your brand ad can appear on a big-screen TV, streaming right after a national brand. This way your ad receives the afterglow of playing right after a Tide commercial on a 70” screen rather.

    Ready to put OTT into practice?

    To drive performance with target consumers, small and medium businesses should consider including OTT as a component of their cross-platform strategy. Emerging brands can use it to build awareness with new consumers, and established companies can use OTT to remain relevant.

    Unsure of where to start with OTT? Contact the experts at Search Influence to discuss how you can use these tactics as part of a full-funnel strategy to drive leads for your business.

  • Four Steps to Adapt to Apple iOS 14’s Impact on Your Facebook Ads

    This post was updated by Marissa Wehrer on August 24, 2021 to reflect updated news. It was originally published on January 20, 2021.

    Key Insights

    • Apple’s iOS 14.5 privacy update has had an industry-wide impact on businesses that use web conversion events to optimize, target, and report using Facebook’s business tools, such as the Facebook Pixel.
    • The update will allow users to opt-out of having their activity tracked across other companies’ apps and websites.
    • Take these four steps to adapt to this industry-altering change and run conversion campaigns in the future.
      1. Complete domain verification to configure pixel conversion events for Aggregated Event Measurement.
      2. Prioritize up to eight conversion events that are most important to your business.
      3. Understand how reporting changes will affect your ability to measure success and optimize your campaign.
      4. Identify new campaign strategies and best practices.

    How Does the Apple iOS 14 Update Impact My Digital Ads?

    On April 26, 2021, a significant update came to iOS 14 devices that asked users if they would like to “Allow Tracking” or “Ask Apps Not to Track” their activity across other companies’ apps and websites. The general consensus is that the majority of iOS 14 users will opt-out of tracking, thus preventing marketers from sending personalized advertising to those who opt-out.

    Apple’s new policy has an industry-wide impact on personalized advertising.

    This update will impact businesses that use web conversion events to optimize, target, and report using Facebook’s business tools, such as the Facebook Pixel. Effects include, but are not limited to, the inability to do the following:

    • Target the right audience with the right message at the right time
    • Allocate budget efficiently to produce the lowest cost per acquisition or return on ad spend
    • Get the same amount of data and granularity of reporting to inform decision-making

    Understand the scale that your campaign performance could be impacted by reviewing your ad account’s Impression Device delivery breakdown. This will help you analyze the percentage of your impressions served to Apple devices.

    Facebook campaign options in iOS14

    Despite these daunting changes, personalization is not at a total loss. Facebook Ads will remain an effective advertising channel if you rethink your current strategies and best practices.

    If you plan to use Facebook Advertising as a lead driver and revenue generator, the following four steps will be vital to run conversion campaigns due to Apple’s upcoming AppTrackingTransparency framework for iOS 14.5 users.

    Step 1: Complete domain verification to configure pixel conversion events for Aggregated Event Measurement.

    Aggregated Event Measurement is a new Facebook tool that “processes pixel conversion events from iOS devices” in compliance with Apple’s new policy while ensuring advertisers can still run effective campaigns. This tool can only be accessed once your domain is verified.

    As a new best practice for all businesses, you must complete domain verification. Domain verification is a way for you to claim ownership of your domain in Business Manager.

    Following Facebook’s instruction, “Domain verification needs to be done at the effective top-level domain plus one (eTLD+1). For example, for www.books.jasper.co.uk, books.jasper.co.uk, and jasper.co.uk, the eTLD+1 domain is jasper.co.uk. This can help ensure that your domain verification will encompass all variations.” (Source)

    How to verify domains on Facebook

    Step 2: Prioritize the Eight Conversion Events That Are Most Important to Your Business.

    Once domain verification is complete, you must use the Aggregated Event Measurement tool within Events Manager to set up the events that you want to track and their corresponding priorities. As a reminder, events allow Facebook’s machine learning to better target, optimize, and measure campaign performance.

    With the Aggregated Event Measurement tool, Facebook is requiring you to define up to eight conversion events, whether standard events or custom conversions, per domain (this includes subdomains) and to put them in order of priority.

    When it comes to prioritizing the events, you are going to put the most valuable action first and the least valuable action last. When a user completes multiple actions within a conversion window, only the highest priority event will be counted, and the conversions for the lower-prioritized events will not be counted.

    If your campaigns are currently optimizing for over eight events across the same domain, make it a priority to strategize and select the eight events you will optimize for moving forward. If you are currently operating under the limit of eight events, then prioritizing your events is quite simple.

    Follow Facebook’s documentation to configure Aggregated Event Measurement with your conversion events.

    Screenshot of web event conversions in Facebook backend

    Once you have prioritized your events, adjust your conversion campaigns’ ad set optimization events accordingly. You’ll also need to ensure your conversion ads are attached to the proper domain at the ad level in the Tracking section.

    Step 3: Understand how reporting changes will affect your ability to measure success and optimize your campaign.

    There are new reporting limitations that you should note, as they may affect how you measure campaign success and optimize campaign performance.

    Delayed reporting:

    Data may be delayed up to 3 days, which could severely impact optimizing short-run campaigns. Another key difference is that conversions will now be reported at the time the conversion actually happened, instead of getting attributed to the last ad impression or click.

    Estimated results:

    Statistical modeling may be used to account for conversions from iOS 14 users.

    No support for breakdowns:

    Delivery and action breakdowns, such as age, gender, region, and placement will not be supported. This could greatly impact how you review and optimize campaign performance.

    To test theories based on delivery and action, you will need to manually run tests, likely by creating more targeted ad sets. However, be mindful that this directly goes against Facebook’s best practice to use broad targeting to improve machine learning. (Source)

    Changes to account attribution window settings:

    First, the attribution window for all new or active ad campaigns is now set at the ad set level to ensure that the conversions measured are the same ones used to optimize ad delivery.

    How to do Facebook optimization and delivery

    Additionally, the new default window is a seven-day click attribution window, and 28-day attribution will not be supported for new or active campaigns. The following windows will be supported under the new attribution setting:

    • 1-day click
    • 7-day click (default after Apple’s prompt enforcement in April)
    • 1-day click and 1-day view
    • 7-day click and 1-day view

    As of January 2021, we saw a decrease in conversions due to the new attribution window settings set by Facebook.

    Step 4: Identify new campaign strategies and best practices.

    Optimizing: Test new optimization events

    By being limited to only eight events, this may force you to determine new best practices on how to optimize your campaigns. If you previously optimized your campaign with low-funnel custom conversions, you may need to test broadening your optimization events to less-granular or higher-funnel actions to encompass more website touchpoints.

    And if you haven’t switched to Campaign Budget Optimization (CBO) yet, then now may be a good time to let Facebook’s machine learning take some of the guesswork out of optimizing your campaign.

    Targeting: Test new audiences and targeting

    Our ability to target and remarket to your ideal customer with personalized ads will be severely limited. Mitigate the effects of the iOS update first by leveraging in-app products such as Facebook and Instagram Shops, lead gen forms, and using video. On-Facebook, engagement tends to be remarketable, which could replace some of the website data you’ll lose.

    Take advantage of the most available data by using customer list custom audiences to build remarketing and lookalike audiences with website audiences using the pixel.

    You may also want to consider removing the Audience Network as a placement from your ad sets because Facebook is not confident in its ability to deliver personalized ads for this placement to iOS 14 users.

    Facebook stated, “Ultimately, despite our best efforts, Apple’s updates may render Audience Network so ineffective on iOS 14 that it may not make sense to offer it on iOS 14.” (Source)

    Reporting: Test new key metrics

    If you currently report using breakdowns by delivery or action, determine how or if you will continue reporting on this granular data moving forward. Since these reporting breakdowns are no longer available for conversion data, you may need to determine new key metrics to report on.

    Navigating a New Digital Landscape

    Apple’s iOS 14.5 privacy update is transforming the digital advertising landscape. Campaign performance may see its biggest impact around Q4, which is the six- to nine-month mark from the iOS 14.5 update. This is mostly because audience sources using website tracking will shrink even more since we can’t collect the same amount of data we once did. We’ll also see more adoption of the updated iOS as people upgrade their phones.

    Stay on top of the upcoming changes and create new best practices for optimizing, targeting, and reporting to maintain control of your accounts.

    It’s okay to feel a bit confused about the effects on your Facebook Ads because no one has all of the information or answers yet. If you have questions about how you can still generate leads for your business despite these changes, one of the experts at Search Influence can help. Contact us today to learn more.

    Resources:

    Images:

    Mobile phone users

  • How to Use Consideration Content to Move Prospects Down the Funnel

    Key Insights

    • Understanding the buyer’s journey is key to developing content that leads to conversions.
    • The goals of consideration content are showing prospects how you can address their problem and getting them to add your business to their list of options.
    • There are several types of consideration-level content that can be created and tracking methods to determine if your content is successful.

    Imagine you’re the marketing coordinator for a small college that caters to working adults looking to change careers. Your ideal prospect is at home with their kids, frustrated with their current employment, and they decide they’d like to go back to school and get a degree or certification. They’ve now identified their need for your service.

    They begin researching going back to school and land on a blog on your college’s site titled “8 Reasons to Consider Going Back to School.” Your team’s goal is now to get the prospect from the very top of the funnel to the consideration phase and through to conversion. But, how? In this post, we’ll discuss the consideration stage, what consideration content looks like, how to plan content creation, and how to track its success.

    A woman on a laptop

    What Is the Consideration Phase?

    The consideration phase is a stage in the marketing funnel. The marketing funnel visualizes the path that your potential customers will travel through on their purchase journey. This funnel consists of five stages: awareness, consideration, decision, conversion, and delight.

    • Awareness: The prospect is aware of their problem or need and potential solutions to address it.
    • Consideration (also sometimes referred to as Interest and/or Evaluation): The prospect shows interest in solving their problems by evaluating their options.
    • Decision: The prospect is actively evaluating your brand and maybe others.
    • Conversion (also referred to as Commitment or Close): The prospect closes and becomes a customer.
    • Delight: This stage involves maintaining communication with your customers after they’ve made a purchase. Your goal is to establish brand loyalty and make customers promoters of your business.

    Understanding the buyer’s journey is a key to developing content that leads to conversions. You’ll want to create content that understands your prospects’ problems and help them understand the options to mitigate their problem. The consideration phase in the buyer’s journey is where you want to offer your target audience content that will have them actively consider your business as a solution to help solve their problem. You’ll want this content to be informational but not too sales-y and overly promotional.

    Defining Consideration Content

    During the consideration phase, your content should highlight your products and services. What makes your product or service unique? What do your current customers and clients think about you? Are there free trials or demonstrations you can offer? You’ll want to help your prospect decide on their solution, and there are several types of content you can create to guide them to the decision phase.

    Downloadable Content

    Downloadable content can help usher your prospects from consideration to conversion. There are multiple types of downloadable content, including:

    • White Papers: A report or guide that informs the reader about a specific topic. White papers are usually an authoritative, in-depth persuasive piece that presents a problem and then provides the reader a solution.
    • E-Books: These longer-form downloads are similar to physical books. In contrast to white papers, they may be longer in length and even more in-depth. E-books may include a layout that makes information easier to digest.
    • Content Downloads: This type of content is usually in the form of a PDF and shorter than both a white paper and an e-book and includes informational content about a topic related to your product or service.

    Videos

    Video content is great for storytelling and demonstrations. This could be a how-to video or a customer giving a riveting review of their experience with your services. The great news: you can create effective and engaging video content in-house with online resources.

    Cost Calculators

    Everyone has a budget, and cost calculators can help your prospect see the projected cost of your services or product and if there are any money-saving bonuses available. Cost calculators allow a user to input a few variables and get an estimated cost for the product or service. These are common across colleges and universities to calculate student tuition but can be useful for other industries like software companies or home improvement businesses.

    Webinars

    These virtual events can be a workshop, lecture, or even a simple presentation. Webinars allow your prospects to engage with your business while gathering relevant information about your product or services.

    Planning Consideration Content: How to Brainstorm

    You should build your consideration content around two things:

    • Answering your prospects’ questions
    • Addressing their pain points

    Here are some ideas to help brainstorm and begin planning out consideration-level content.

    Tap Into Customer Feedback

    You can utilize customer feedback from review sites, surveys, and testimonials to get an idea of your customers’ frequent questions, concerns, and general feedback. This creates relevant, helpful content since it’s based on what your customers are already saying and asking about your business.

    Focus on the Sales Process

    During your sales process, you probably get a lot of good questions from prospects. This is a great place to get content ideas. If a prospect has a specific question during a consultation, it’s likely other people who may be researching your product or service have it as well.

    Use Search Phrases

    Doing keyword research can give you an idea of questions people have about your industry and services. This can be done in a few ways:

      • Google Search Console: With Google Search Console, you can see which queries give impressions to your website. Look for queries that have high impressions but no clicks; these may give you ideas of what people are looking for and provide questions to answer.
      • Google Auto Suggestions: If there are phrases or questions you know your customers or prospects use to find you or ask, you can place these into Google and take note of the suggestions Google presents to you. These searches are so common that Google is suggesting them to you.
      • Google Keyword Planner: Google Keyword Planner is usually used for Google Ads campaigns, but you can use it for organic content development as well. Similar to above, add the phrases to the tool to get more keyword ideas.
      • Answer the Public: This tool visualizes search questions and suggested searches. Drop a keyword related to your product or service, and Answer the Public will provide you with hundreds of questions that can be used to help you develop your content.

    A man writing notes with a pen and paper

    How to Set Goals and Track Success

    Now that you know what consideration content is and how you can start planning your own content, how do you get users and prospects to engage with your content? To get them to take that desired next action, you’ll need the right call to action. What is the next step to expect from a prospect at this stage? You’ll need to understand your buyer’s journey to know what the appropriate call to action is.

    Typically, moving into the consideration stage involves the prospect making a small commitment in exchange for their contact info for one of the pieces of downloadable content we mentioned above.

    Depending on your buyer’s journey, the next step could be a light or hard ask to:

    • Visit your website
    • Sign up for a webinar
    • Download a PDF or white paper
    • Filling out an inquiry form

    When your prospect takes whatever action you define, this will move them into the consideration stage of the marketing funnel.

    How will you know if your content is successful? What metrics should you measure? To successfully track and measure your digital marketing efforts, you should set up Google Analytics to report site traffic, visits, conversions, and other tracking metrics.

    At the consideration stage, you should be measuring:

    • Call-to-action performance
    • Content downloads
    • Site traffic
    • Time on site
    • Bounce rate
    • Comments
    • Video watch time

    Consideration content is all about engaging your prospects, answering their questions, and moving them to the next stage in the funnel. Now that you know how to create content, what will you work on first?

    Partner with Search Influence to develop a custom marketing strategy that aligns with your business goals and helps move your prospects down the marketing funnel and closer to the sale. Schedule a free consulting session with one of our strategists to get started.

    Image Source:

    Woman on a laptop

    Man with a notepad

  • Should You Switch to Google Analytics 4?

    Key Insights:

    • A new version of Analytics is available and comes with some major changes.
    • Google Analytics 4 (GA4) is more beneficial to those with both website and app properties to track together than for website-only users.
    • We recommend setting up both old (Universal) and new (GA4) properties to run concurrently and change over fully only when that seems comfortable for the user and situation.

    In October 2020, Google officially launched its new form of Google Analytics properties known as GA4. GA4 originates from the integrated “App + Web” properties, which Google rolled out as an option for Universal Analytics properties years ago, but GA4 makes App + Web configuration the standard for all online properties. If the prior iterations of Google Analytics were variations on a theme, then GA4 is a completely different song.

    Since many businesses depend on Google Analytics data to assess their success and address the user experience of their online properties, any major change to the platform will have a significant impact. In this post, we’ll look at the details behind some of those changes and help you determine if the transition to GA4 is immediately beneficial to you.

    A person typing on the computer

    What Makes GA4 Such a Major Change?

    The major, fundamental difference between GA4 and prior Google Analytics versions comes down to reporting mechanisms.

    Prior versions of Google Analytics treated Pageviews as the primary metric for web property activity reporting, with a Session as the primary identifier for an individual user’s path. This measurement and reporting was based entirely on data stored in browser cookies. There are many, many resources for a thorough technical breakdown of how Universal Analytics and prior Analytics versions define and utilize Sessions and Pageviews and how they used cookies to collect that data.

    For our purposes here, we need to know that Google defined Sessions as an activity reported via a browser cookie from one browser (interpreted as a “user”) before either removal of the Analytics tracking cookie or 30 minutes of inactivity on the reporting website. Within that basic Session framework, the reporting on that user’s activity centered on Pageviews, with user-defined Events as an auxiliary means to target and measure specific user actions. You could find plenty of data about your users’ paths to and across your web properties without using Event measurement at all.

    The key conceptual change with GA4 is that Google made Events the foundational metric of reporting, with a Pageview treated as a specific type of Event rather than a separate entity. While GA4 still measures Sessions (and still utilizes browser cookies to do so), the identification of distinct users and their activity is no longer as dependent on cookies or Sessions to organize web activity. Instead, GA4 primarily uses data pulled from device identifiers and contextual Event analysis to identify distinct users and align them with their measured activity on a website or app.

    If you are using Analytics for reporting on a single website with no connected applications or alternate platforms, this change is likely only relevant to your developers. But if you are using Analytics to track app activity, you’ll have cleaner data that’s more representative of how users interact with applications without that data tracking being reverse engineered to fit the way users interact with a standard website in a browser.

    There are many other changes to reporting and measurement, and the most significant changes are broken down thoroughly by Bounteous. Likewise, the structure and nature of Event and Conversion reporting have changed a great deal, which earned the full Simo Ahava treatment shortly after launch last year.

    Why Make This Major Change Now?

    The biggest reason for these changes is to unify and consolidate Analytics tracking across multiple distinct web properties. The most obvious and direct use case is the fact that GA4 was directly born out of the App + Web property versions.

    Important background for the GA4 changes from the website tracking perspective goes back to the ongoing browser wars against cookies and cross-site tracking. Browsers’ evolving approaches toward user privacy and cookie policies constitute an entirely separate can of worms, but relying less on browser cookies is definitely a solid future-facing plan given the way browsers, internet software, and devices have trended toward greater privacy considerations. We have gone into great depth previously about how changing cookie and privacy policies impact cookie-based Google Analytics tracking.

    Google’s continued use of cookies for Analytics tracking in GA4—combined with the fact that, in most cases, the Google Analytics cookie is not being set as a dreaded third-party cookie—means that the actual difference in tracking capabilities for traditional websites is insignificant.

    Concepts like Sessions and Pageviews don’t apply to apps the same way they do to websites because of how these online properties are built and used. GA4’s biggest and most impactful immediate step forward is establishing a unified measurement system across these contrasting user platforms.

    While we’re still learning the capabilities and possibilities with the new GA4 properties, it’s difficult to point to any clear advantage of using the new GA4 properties for website-only organizations at this stage.

    Change Is Good Though, Right?

    There are a few specific changes that are causing significant adjustments for working with our clients’ tracking and reporting at Search Influence so far:

    User Explorer takes a full 24 hours to populate with user data.

    User Explorer has been a huge piece of our testing and QA process for our clients when testing ad campaigns, especially E-commerce Tracking. It lists site users by an anonymized identifier known as a “client ID,” showing the full activity history of each user, including:

    • Session breaks
    • Goal completions
    • E-commerce transactions via E-commerce Tracking

    There’s no way to identify a specific user just by looking at the client ID in your reports. But if you are the user and note your own client ID as you’re using the website, you can see what Google sees, which is extremely helpful in ensuring Goals and transactions are reporting properly.

    In the past, this User Explorer data was usually available to view within 10-20 minutes of performing the activity. If we had to test E-commerce Tracking reporting for a test purchase on a client’s website, we could complete the transaction and expect to see whether or not it tracked correctly pretty quickly. If it did, great! If it didn’t, we could investigate, adjust, and try again almost immediately.

    Currently, in GA4, it takes a full 24 hours for User Explorer data to populate. The results of this can dramatically slow down the process of setting up complex tracking configurations. With GA4, we cannot verify if anything is working until a full day after our tests. If something is not reporting as expected, the best-case scenario is making quick updates and performing another test…and then waiting another 24 hours to see if our adjustments solved the problem. What previously could have been 30 minutes to an hour of work now is spread across at least two full days.

    Many previously standard dashboard reporting sections need to be manually configured.

    For detailed breakdowns of specific dashboard and reporting changes in GA4 vs. Universal Analytics, Krista Seiden has already broken it down more thoroughly than I could. A general takeaway from what we’ve experienced so far is that many reports and metrics combinations that were accessible options straight from the dashboard menu now need to be set up directly by the user. I think in the long term, this will end up being a good thing since the Universal Analytics dashboard had gotten a bit bloated and overwhelming. But we could access several important reports for client reporting purposes “out of the box” that now need to be “manually” generated by modifying options and dimensions for other more general reports.

    Eventually, this will be beneficial, as it’ll allow users to have more control over what they can see and help them understand what data they see.

    A screen showing the pages views of a site

    So, Should I Use GA4 or Not?

    The short answer here is a clear and resounding, “Probably, but don’t completely flip out about it just yet.” There is little doubt that GA4 will eventually replace Universal Analytics as the standard, and as such, it’s appropriate to start considering a transition to the new property type. For organizations trying to unify reporting across websites and apps, some immediate benefits might accelerate the payoff of using the newer version.

    But for website-only businesses and content creators, the immediate benefits of transitioning to the new properties seem pretty marginal, with a lot of organizational strain engrained in adjusting to the new configurations and reporting structure. All Analytics users were forcibly transitioned from Classic Analytics to Universal Analytics in 2016, but as of now, Classic Analytics tracking code and syntax still fundamentally work and report effectively. The situations are not directly analogous, but it’s highly unlikely that Universal Analytics will be deprecated to any meaningful extent any time soon.

    In my opinion, the better immediate option (and what we’re beginning to employ for new clients and strategize for existing clients at Search Influence) is to track Universal Analytics properties and GA4 properties concurrently.

    One of the benefits of GA4 and Universal Analytics being entirely separate properties that don’t acknowledge or interfere with each other is that we can set up both to report simultaneously without any conflicts. This allows us to monitor and learn about the differences between the properties without any major irreversible overhaul to what we already have set up for our clients.

    Once we’re confident that we’re getting everything we need from GA4 so that Universal Analytics is truly redundant, we can then pull the trigger on switching fully. By that point, we’ll already have accumulated some reporting data to avoid any unfillable gaps in comparative historical data.

    To see our most recent thoughts on how to handle the release of GA4, check out this blog post written by our CEO Will Scott.

    Whether you’re trying to decide if your business should make the move to GA4 or want to brush up on your analytics and lead tracking, Search Influence is ready to help! Reach out to one of our digital marketing consultants for a free strategy session.

    Image Sources:

    Person on a laptop

    Computer screen

  • Skimmers, Swimmers, and Divers: Content Strategy for Higher Education Websites

    Key Insights

    • Higher education sites need to be accessible and navigable for visitors in all stages of the marketing funnel.
    • A website optimized for the ultimate user experience can positively impact SEO and search rankings.
    • Learn how to create web content that accommodates readers that are skimmers, swimmers, and divers—this can help create a positive user experience that’ll drive returning site visitors!

    Website content should accommodate a variety of visitors—you want to create the optimal user experience no matter if visitors are just skimming content and gathering a few key points, swimming around on a few pages, or diving deeply into multiple pages and reading as much information as they can. A positive user experience can increase site dwell time and help drive conversions.

    skimmer swimmer and diver graphic

    By optimizing your site for skimmers, swimmers, and divers, you’ve established that it’s an informative, helpful resource for your prospect—no matter what stage of the marketing funnel they’re in. Increased site dwell time also sends a positive signal to search engines and can help your search engine optimization (SEO) efforts. A site developed with the user in mind can create a strong sense of trust with the university, making users more willing to convert, whether by submitting basic personal information, contacting the admissions department, or even filling out an application.

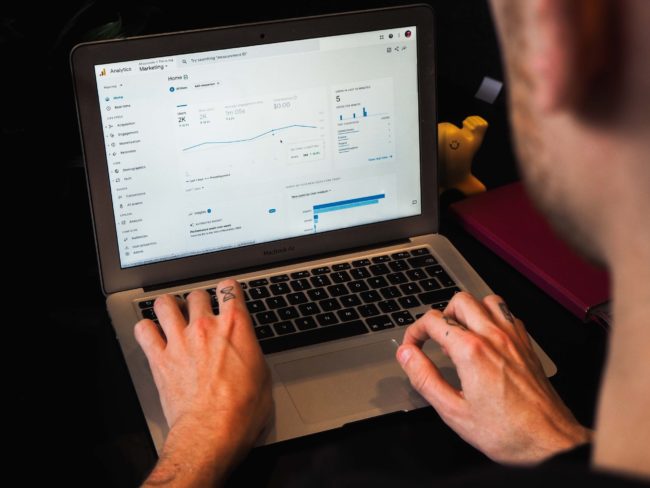
    According to a study by MeasuringU, the most common reasons for visiting a university’s site are to learn more about the school, browse its academic programs, and view course information. While those may be the top sources of traffic, we know there’s plenty of other valuable content higher education sites can leverage to delight users.

    Let’s review common content found on higher education websites and how it can be catered to each type of visitor—whether they’re a skimmer, swimmer, or diver.

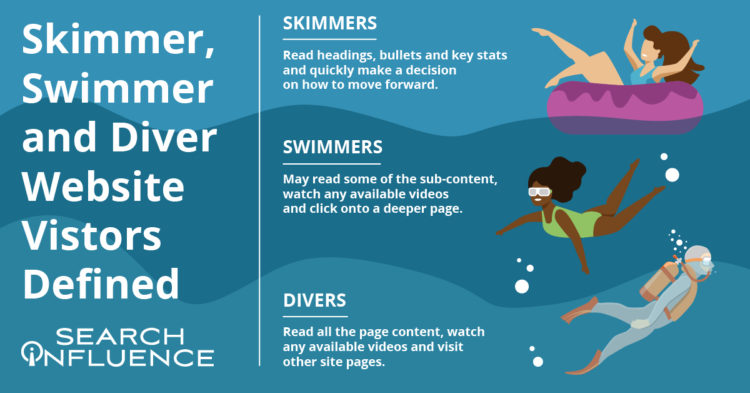
    Defining Skimmer, Swimmer, and Diver Website Visitors

    While reading this blog, you’ll likely tackle the following content either as a skimmer, swimmer, or diver.

    Skimmers will read the headings, bullets, and key stats and quickly make a decision on how to move forward.

    Swimmers may read some of the sub-content, watch a video (if available), and click onto a deeper page.

    Divers will read all the content on the page, watch a video (if available), and will go to other pages on the site.

    My blog post is organized with clear headings, bullet points, and plenty of white space if you’re here to just skim the highlights or even swim a little. I also have in-depth content under each heading, clickable internal and external links, and a straightforward navigation bar if you’re ready to dive into this topic or even deeper to learn more about overall higher education marketing strategies.

    Just like a thoughtfully structured blog post that accommodates each type of reader, website content for any higher education institution should be curated to skimmers, swimmers, and divers.

    How User Experience (UX) Can Affect SEO

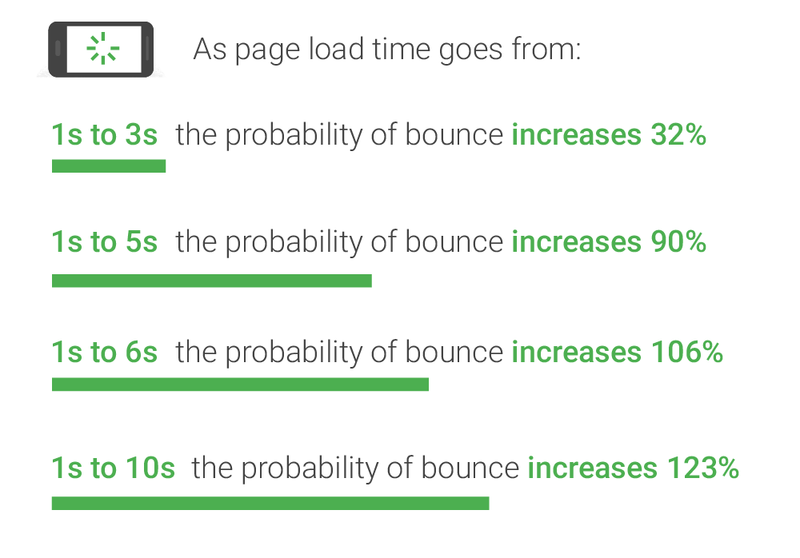
    Why are we even trying to accommodate different kinds of site visitors/readers? It all comes down to creating a positive and informative experience for your audience since they’re likely to spend more time on (and revisit) an accessible, easy-to-navigate site. Search Engine Journal points out that Google’s algorithm consistently takes user experience into account.

    A site optimized for UX is likely to be awarded in search engine result pages (SERPs). It makes sense that UX and SEO go hand-in-hand—the goal of both is to help readers find the information they’re looking for/complete their task with the most relevant information.

    In a previous blog post, we discussed seven actionable steps you can take to make your higher education website more engaging for prospects and students.

    Higher Education Website Content

    Because a higher education site is extensive and covers so many topics, optimizing content for skimmers, swimmers, and divers won’t look the same for every type of page. When building out content, keep your readers top-of-mind by asking what they want and what they’d like to accomplish from each page.

    Let’s focus on three categories of content. All examples and screenshots are from our higher education client, Tulane School of Professional Advancement (SoPA).

    Program and Degree Pages

    Your school’s academic program and degree pages can become quite information-heavy very quickly. These pages usually contain crucial information on in-depth topics such as:

    • Admission requirements
    • Required courses
    • Transfer credit eligibility
    • Tuition

    How can you make these topics accessible without overwhelming your readers? Structure them as accordions. Accordions are structured as a vertical menu with clear headers. Users can click these headers to reveal more information about the topic.

    Formatting sections of an information-dense page as accordions not only cleans up the entire page, it also minimizes scrolling and lets your readers control how much or how little they want to read on the page.

    An example of an information-dense page as open accordions

    An example of an information-dense page as closed accordions

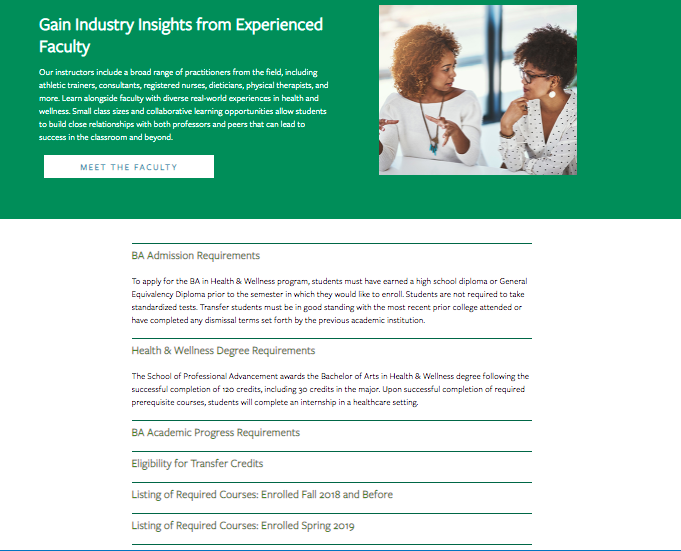
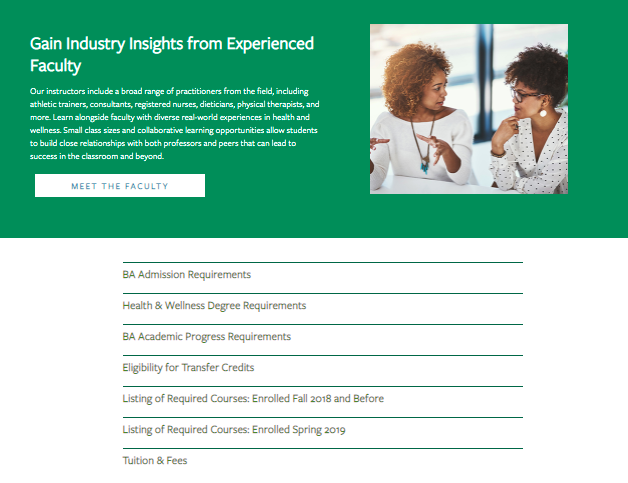
    When visiting the above page for Tulane School of Professional Advancement’s health and wellness degree, swimmers and skimmers may review more general information about the degree before they’re ready to dive into logistics like admission requirements and transfer credits. Less content and less scrolling can help readers not bounce off the page because they feel overwhelmed by too much information.

    Site visitors who are further down the conversion funnel or even first-timers who prefer to get as much detail as possible can click on each topic to get more in-depth information in the drop-down. Accordion menus give readers control over how much content they can consume at a time—and everyone likes to feel in charge.

    Pro tip: Make sure to use clear, concise headers for each accordion section.

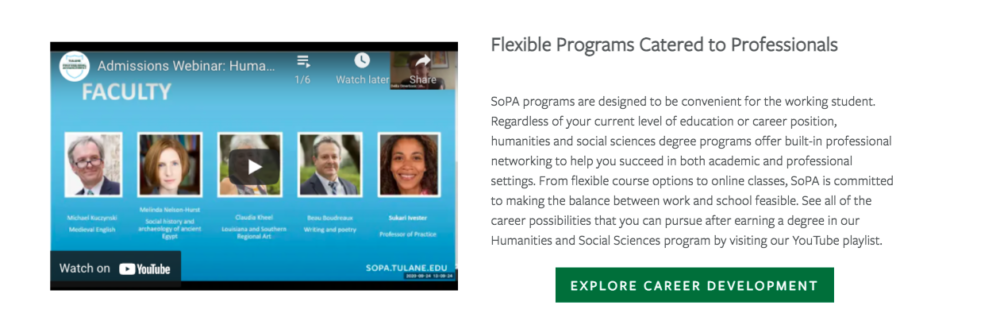
    You can also embed videos and other multimedia to enhance on-site text and give swimmers and divers other ways to explore your content during their research.

    An example of an embed videos to enhance on-site text

    Acceptance Criteria and Application Deadlines Content

    Any information pertaining to an institution’s acceptance and application deadlines should be limited to pages specific to admissions and applying. This content should only be on a few key pages within your school’s site since application and deadline info isn’t evergreen (content that is timeless and remains relevant) and needs to be updated every few months.

    When crafting evergreen content for an academic certificate or degree program page, we don’t want to mention the next application date within the content itself. Pop-ups or stick bars can be used to communicate urgency to prospective students browsing your website when deadlines are approaching.

    Course Requirement Pages

    Most potential students probably won’t dive deeply into course requirement pages unless they’re transfer students.

    Having a list of the course names within a program on its dedicated pages makes sense, but having detailed descriptions of each class is more information than potential students need at the moment. Detailed course descriptions are best displayed in a separate on-site course catalog or on an internal site for current students.

    SoPA Cert Page

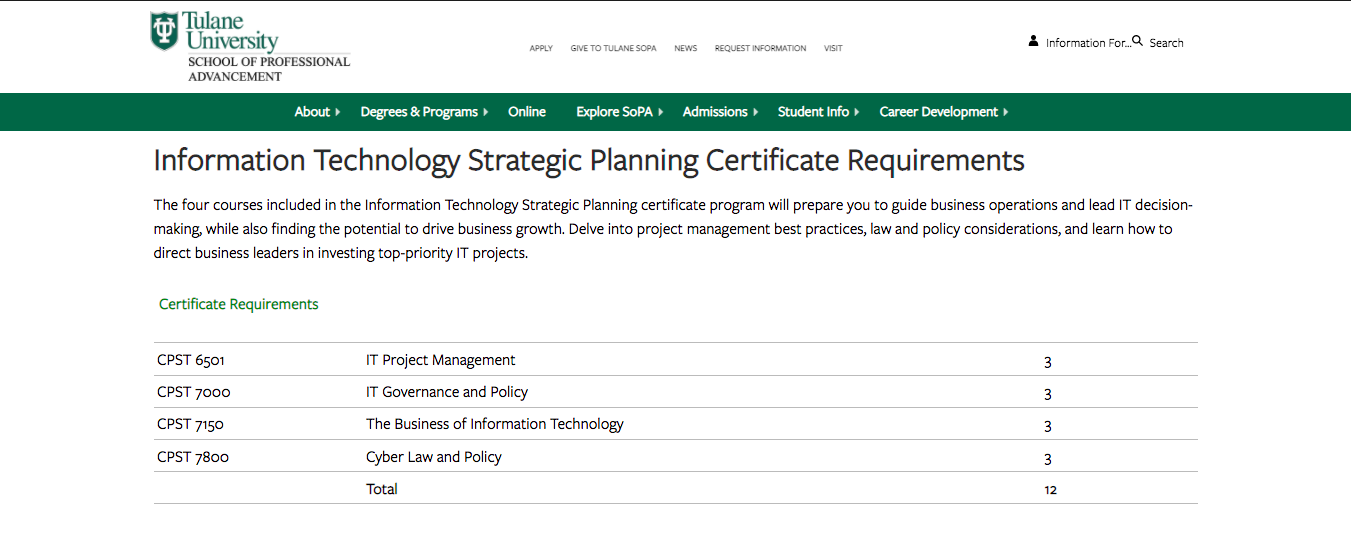
    Tulane SoPA lists all the course requirements needed for an IT Strategic Planning Certificate without cluttering the table with course descriptions. The course reference number is listed, so deep divers can look up the course description in the on-site course catalog if absolutely necessary.

    Higher Education Blog Content

    Following a consistent blogging schedule not only provides useful, industry-relevant content to your current and prospective students, but also keeps your site updated and signals to search engines that it’s trustworthy.

    Most of the following guidelines can be applied across your site content, not just for blog posts.

    Break Up Content

    Structure blogs with subheaders so readers will know exactly what the post covers at first glance. Subheaders—H2s and H3s—visually organize your content and help make it more accessible and scrollable for readers, whether they’re skimming, swimming, or diving headfirst into your blog.

    Other ways to break up long lists and paragraphs include:

    • Bullet points
    • See what I did there?
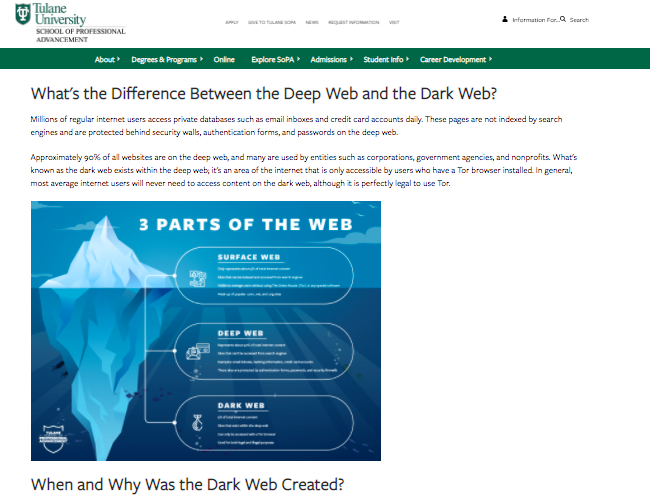
    Images and Graphics

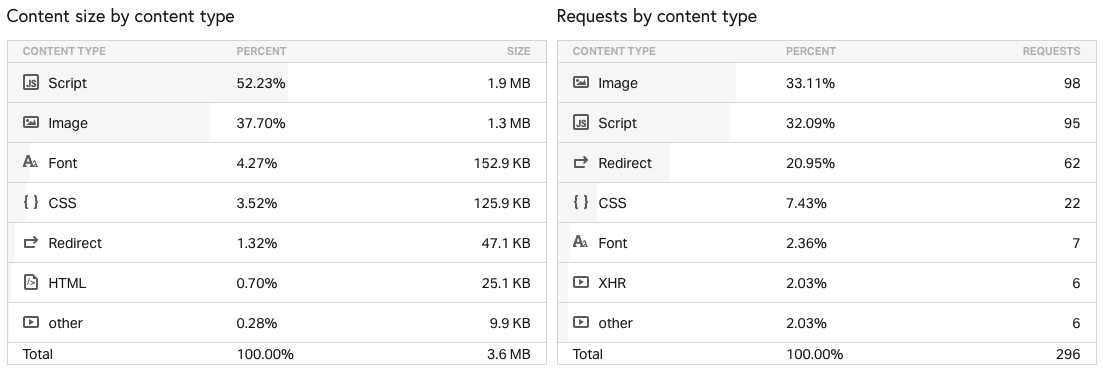
    Images are a powerful tool that can make your blog posts pop and entice visitors to read your content. They can also be used to break up content, making it more skimmable for readers intimidated by a wall of text. Try using more than one image. HubSpot reports that blogs with an image every 75 to 100 words get double the shares compared to other blogs.

    Pro tip: Use diverse photos and vector graphics to reflect different genders, races, body types, and abilities in your blog images; all prospective students should see themselves represented in your creative.

    Infographics can be repurposed as mini-infographics and featured alongside related blog content to add more visual appeal, break up the text, and to expand on information covered in the blog.

    Mini-infographic

    Mini-infographics are excellent ways to include statistics or facts in a more interesting, eye-catching manner.

    Links and Calls-to-Action

    Help your readers move along the marketing funnel with clear, specific internal links and call-to-action opportunities in all blog content. Internal links should send your readers to additional and helpful pages deeper into your site. Links unrelated to the hyperlinked text or blog content can create distrust with visitors, leading them to bounce off your page.

    When creating an internal link, always ask how the page can help your reader. If you can’t come up with a straightforward answer, then ditch that link.

    Every blog should end with a call-to-action, or, an opportunity for your reader to take the next step. Depending on where they are in their prospective student journey, this next step could be:

    • Visiting a program page to learn about a degree
    • Contacting an admissions counselor
    • Starting their application
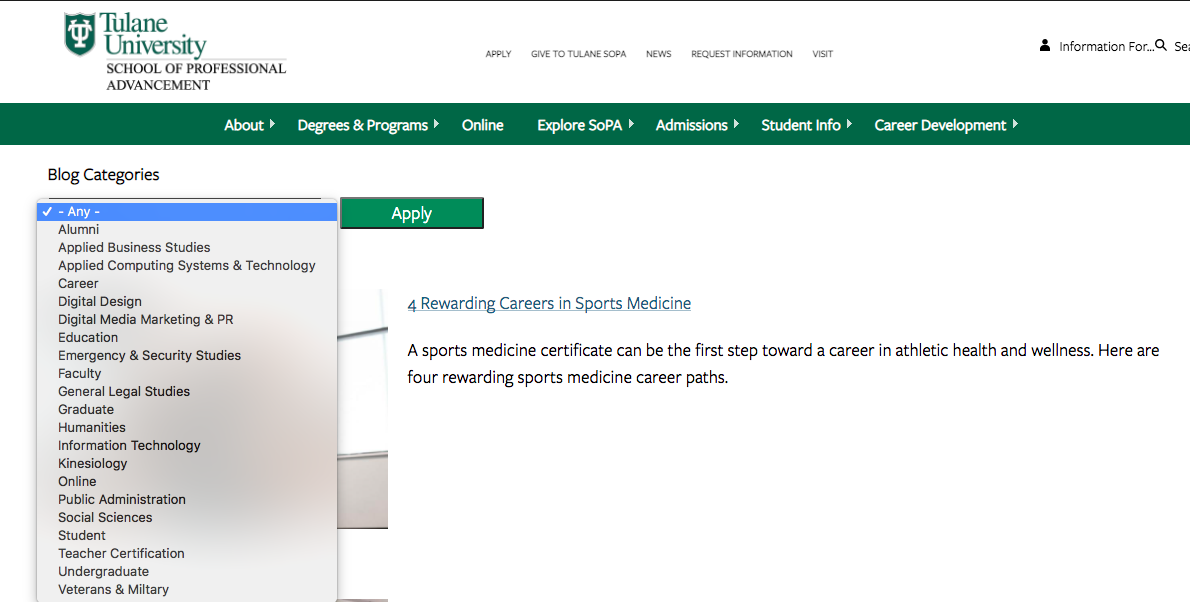
    Blog Categories

    While this isn’t exactly content-related, sorting blogs by category helps users easily search blogs catered to their interest (enhancing UX!) and can help minimize bounce rate. Even if site skimmers and swimmers don’t do a deep dive into too many blogs, they’ll be able to see the depth of topics covered.

    SoPA blog list

    Content Download for Degree Programs

    Content downloads are one to two-page info sheets about a specific program or degree. They function as gated content (the user must provide basic info in exchange for access) to capture leads who are interested in this program or degree.

    SoPA 1-Pager Download

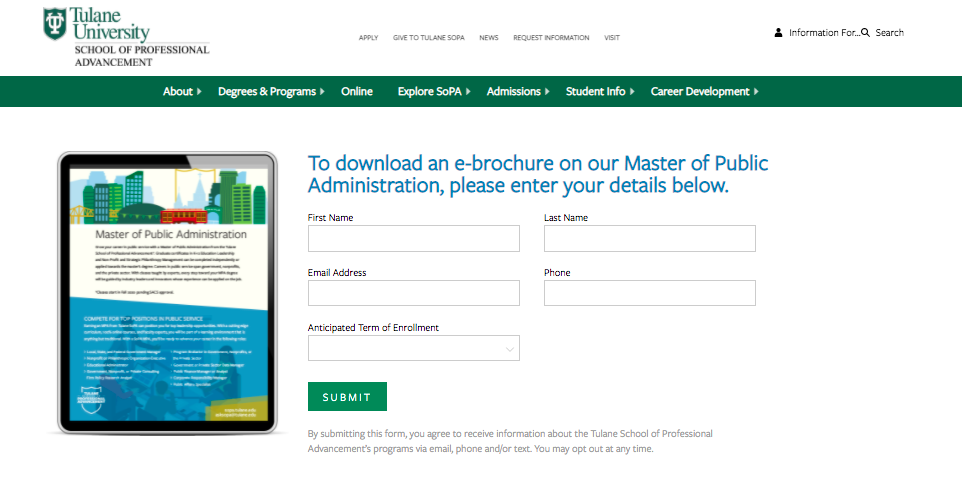
    Content downloads can be the ultimate deep-dive for visitors wanting to get as much information as possible. They’re also a measurable way to track site visitors that eventually turn into leads. Divers or visitors further down the marketing funnel are more likely to submit their email to download more in-depth information about a program.

    This submitted email can be used as a trigger to launch an email nurture campaign that helps guide potential students along every stage of the marketing funnel.

    Elevate Your Higher Ed Content Marketing Strategy With Search Influence

    Work with digital marketing experts who can help you lead an effective content marketing strategy that helps you move prospective students down the funnel. Contact one of our strategists today to discuss your lead nurturing tactics and digital marketing strategy.

  • Search Influence Presents Virtual Higher Education Marketing Training, “How to Gain Stakeholder Trust & Buy-in on New Marketing Strategies”

    Watch the recording of this training session here.

    Search Influence education webinar on gaining stakeholders trust

    About the Virtual Training

    As an education marketer, it’s your job to help deans, admissions, and other stakeholders understand how new marketing strategies will fuel student growth.

    Join Search Influence for a virtual training that demonstrates how to build a case for new marketing efforts, including tips on how to showcase how they’ll help you reach your audience and impact your institution.

    Learning Objectives for this Event

    • How to use and quantitative goals to plan and pitch marketing strategies
    • Tactics to demonstrate how a given strategy will help you reach a specific target audience
    • Guidance to tailor your discussion based on personality styles and role
    • Opportunities to leverage data in your decision making and discussions
  • Search Influence Receives 2021 New Orleans Top Workplaces Award from The Times-Picayune and The New Orleans Advocate

    Top Workplaces 2021 Nola Times Picayune Search Influence award graphicFor the second year in a row, Search Influence has been named a winner of the New Orleans Top Workplaces Award by The Times-Picayune and The New Orleans Advocate. Search Influence is among a list of 70 independently selected private, public, non-profit and government entities selected for the 2021 awards. The rankings of the companies in their respective categories will be announced at an awards ceremony later this year.

    Top Workplaces awards are based solely on feedback captured from one, five-minute employee engagement survey. There are no subjective elements to the process, making Top Workplaces the most credible, authentic employer recognition program. Any organization in the seven-parish metro area with 35 or more employees was eligible to compete this year.

    Search Influence prioritizes its company culture, embedding its values into communication, client work, and internal recognition and evaluation. The company weaves these values into their recruitment process, which ensures that all who join align with Search Influence’s vision.

    Search Influence’s core values spell CHARGED:

    • Collaborative
    • Hungry
    • Agile
    • Reliable
    • Genuine
    • Effective
    • Dedicated

    The trend from last year’s survey continued, with the team emphasizing transparency and culture as two key reasons they appreciate working at Search Influence. Team members responded positively about the support they receive from managers to learn and grow, as well as their manager’s care for their concerns. Additional aspects of the company highly rated by employees include: interdepartmental cooperation, appreciation of fellow teammates and the encouragement of new ideas.

    “We are very pleased to be included in Top Workplaces for the second year in a row,” said Search Influence CEO and Co-founder Will Scott, “We value Top Workplaces because the award and rankings are based on empirical data. In a year which has been so hard for so many, we’re glad to know our team still felt like they were both challenged and supported.”

    This is the seventh year of the New Orleans award, which is facilitated by Energage, a third-party company who conducts a quantitative and qualitative assessment of nominated organizations.