Blog

  • No. Don’t “Upgrade” to Google Analytics 4 (GA4). Instead, install it and run it in Parallel.

    Don’t “Upgrade” To Google Analytics 4 (GA4) Just Yet

    Google has been urging Analytics users  – mostly by email – to “Upgrade” to Google Analytics 4 (GA4).

    At Search Influence, we are installing GA4 but not “upgrading” just yet.

    No doubt, GA4 will be a great improvement, but there are a few really compelling reasons not to go all in just yet.

    A while back, David, our senior web developer, wrote a pretty comprehensive blog post about switching to Google Analytics 4, which you should check out. Below, I’ll reiterate a couple of his points, plus a few more.

    Google Analytics 4 user interface - Should you upgrade to GA4?

    Google Analytics And The Cookie-less Future

    In short, a big reason for this change is to accommodate a cookie-less world. As users can now opt out of tracking, it may be more difficult to gather user experience data if cookies are the way you get that done.

    Google Analytics 4 is not yet a fully baked product. Google tends to take an agile development approach and test new products and features with users.

    Even though it is Cookie-based, Universal Analytics – the current version – is a stable product.

    Do You Even Track Metrics, Bro?

    Google Analytics is great, but there are things it doesn’t do well. Some of the tools that you use to supplement Google Analytics may be negatively impacted if you make the switch too early.

    Some examples:

    In short, just because the Google Analytics team is ready for you to switch doesn’t mean everybody else is. Third parties and even some Google Properties development teams have to catch up to the GA4 APIs and interface changes.

    Third-party tool providers need a chance to get caught up with the new Google Analytics.

    Search Influence And GA4 For Clients

    Google plans to deprecate Universal Analytics as of July 1, 2023.

    In the next few weeks, we will be installing the GA4 tracking code on our client sites (again, alongside Universal Analytics) or recommending their developers do if we don’t have access.

    This way, we will have a full year’s worth of data when Universal Analytics sunsets.

    We’re not making a wholesale switch right now for the reasons above, but we feel it’s important to start collecting data in the new tool to enable good historical reporting in future years.

    We use CallRail and Google Data Studio for most of our client reporting and some internal dashboards, too. We are not willing to risk the integrity of that data for decision-making and reporting to move the newest, coolest Google toy.

    Again, David’s post goes into much more detail about switching to GA4, but I hope this gives a high-level view of the Search Influence approach to integrating this new platform.

    And, of course, if you need help setting up Analytics, Tracking, and Reporting for your organization, please get in touch. We’d love to help.

  • 5 Minute Power-Session: Solving 3 Key Higher Education Marketing Data Challenges

    5 Minute Power-Session: Solving 3 Key Higher Education Marketing Data Challenges

    When it comes to marketing and recruitment pipeline data and analytics in higher education, there are a few common challenges universities and professional, continuing, and online education units (PCOs) often face:

    60% of Higher Ed Marketers do not know cost per inquiry

    Silos within the university

    Marketing is responsible for owned and paid media including the website, social media channels, and placing media buys but it often has limited or no access or insight into the enrollment CRM. Meanwhile, the recruiting team isn’t even aware of the depth of rich data available to them about prospects and current students. The existence of this data presents an opportunity for marketing to better understand the ideal student, and adjust their strategy to reach more of them, in a more effective way.

    Data systems challenges

    Many institutions have data about their students and prospects living in disparate systems, there’s simply too much of it, and it is incredibly time consuming to collect and understand, much less piece it together for insights.

    Fragmented data

    There’s largely an inability to string together information about a single prospect all the way through the recruitment to enrollment funnel, or even to understand the funnel end-to-end.

    Recently we were honored to present a quick 5-minute power sessions at HighEdWeb Analytics Summit, where we dove into Marketing Data, Dashboards, and Decisions, with a goal of helping universities and PCO’s understand the impact they can have when they’ve done the work to better understand their own first party data and overcome these common data challenges.

    Higher ed marketer looking at marketing metrics

    As we’ve presented this and similar insights to higher education stakeholders and conferences over the last 3 years, we’ve polled to get an understanding of where most institutions fall within those 3 key data challenges. The results are telling: 60% of our respondents didn’t know how much they currently spend on marketing for an inquiry. As an analytical marketer I can tell you – that pains me!

    Check out our presentation for more on where to start to overcome the most common data challenges facing universities today, tools you can use to facilitate deeper insights, and examples of how access to data can influence key decisions and strategic direction.

  • Search Influence Presents Virtual Training in Partnership with the Mississippi Hospital Association

    Search Influence presents “Communicating Through Pandemic and Weather Events: Planning for Happier Patients” in partnership with the Mississippi Hospital Association (MHA) on Wednesday, May 18, 2022. This is Search Influence’s fourth time partnering with the MHA for a virtual training just for the organization’s members.

    The MHA is the statewide agency for health care representation and serves to all hospitals, wellness types, and health care networks, as well as the patients and communities they serve. MHA is comprised of over 100 hospitals, health care systems, networks, care-providers, and a pool of over 50,000 employees.

    MHA Webinar Communicating Through Events Graphics

    About the Virtual Training

    Your patients are frustrated when they can’t confidently find information about your hours and availability. If you have inaccurate information on your digital platforms, your staff has to spend extra time managing patient confusion, your patients lose confidence, and your brand reputation suffers.

    The combined impacts of the pandemic and the frequency of unexpected weather events means your staff must have an agile, thorough plan in place to communicate changes to the public. Through our webinar, you can learn how to improve the patient experience and free up your staff.

    In just 30 minutes, we will walk you through what needs to be updated, who needs to do it, and when it needs to be done.

    Learning objectives:

    • How to present your information online to increase patient confidence
    • Which platforms external to your website are critical to update
    • Steps to create a digital presence emergency preparedness plan to improve patient experience in the event of a weather event, such as a hurricane
  • How a New Orleans Digital Marketing Agency Uses the DISC Methodology to Improve Client Relations

    Key Insights:

    • Tailoring a message to compliment the intended person’s personality helps build rapport and trust within a professional and personal relationship.
    • Personality types affect how people communicate with each other effectively—it is the main reason people respond and act in their own unique ways.
    • The experienced Search Influence team tailors our communication, reporting, and working style based on our stakeholder’s perceived DISC type.

    Introduction

    Personality types affect how effectively people communicate with each other—it is the main reason people respond and act in their own unique ways. This is especially true when it comes to business relationships. The entire account management team at our New Orleans digital marketing agency uses the DISC methodology to learn more about each client’s personality styles, allowing our team to strengthen and build relationships by adapting to each client’s unique behaviors.

    DISC Methodology

    The DISC methodology is a personal development framework that helps us understand ourselves and how we interact with others. From Fortune 500 companies to nonprofit organizations and small-owned family businesses, companies worldwide use the DISC methodology.

    The DISC methodology comprises four personality types: Dominance, Influence, Steadiness, and Conscientiousness. Understanding all four of the unique personality types in the DISC methodology promotes productivity in the workplace by developing better communication that leads to healthy relationships.

    Search Influence’s account management team uses the DISC methodology to aid in client communication. We customize our emails, reports, and presentations to both our primary point-of-contact and and their stakeholders, providing information in varying formats to suit their different personality types and roles.

    Dominance

    The D in the acronym DISC stands for dominance. Approximately 9% of the worldwide population have the personality traits classified as dominance. According to extendeddisc.org, people with this personality type tend to be motivated by competition, winning, and success. They have a deep appreciation for exploring new opportunities and achieving independence. They value action conversions and fear looking vulnerable or weak.

    Typically a team leader, executive, public speaker, or account executive, dominant personality types excel in authoritative roles. At our New Orleans digital marketing agency, we use brief and direct, to-the-point communication with D personality types. We also make sure we speak in terms of “What” not “how,” because D types are interested in what we are doing to make improvements, not how we are doing it. By talking about results, not processes, our account managers keep communication productive with D types.

    People working in a boardroom

    Influence

    The next personality type in the DISC acronym stands for Influence. According to extendeddisc.org, these people make up about 29% of the world’s population. Those with this personality type are often warm, trusting, and energetic.

    I types prioritize shaping their environment by influencing others. They can persuade others with their charm, optimism, and energy. With their ability to generate excitement, I personalities value their friendships and pursue them with happiness. Their overall goal is to attract attention with their outgoing personality.

    Often designers, copywriters, or creative directors, Influence personality types respond well when allowed to verbalize their ideas. Allowing I types to communicate freely and creatively enables them to explore new ideas and discover new approaches to problems at hand.

    At Search Influence, we strive to build friendly lines of communication with I type personalities. This more casual and laid-back style allows I types to feel comfortable and let their ideas flow. Once a relationship and open lines of communication have been established, our team is able to craft a collaborative environment where I types can use their excellent verbal and creative skills to communicate their vision and pursue new opportunities.

    Steadiness

    The third personality trait in the DISC methodology acronym is Steadiness. According to extendeddisc.org, the S style comprises 31% of the population. These people are steady, calm, and easy-going. This candidate prefers continuity and familiarity—they tend to sway away from new ideas, as this makes them feel uncomfortable.

    Often asking “How” questions, S styles want to gather all the details to think about the best plan for execution. These personalities are very poised and stable, do not get overly excited, and are rather patient and careful when making decisions. S personalities thrive when they are in a routine and can interact with other people regularly. Because of this, S personality types are often counselors, HR directors, doctors, and executive assistants.

    When discussing our digital marketing services with S personalities, our team ensures to craft a predictable and stable work environment where S types can plan for the future and stick to the agreed-upon routine. For example, our team might make a special note not to reschedule meetings with S types because this could throw them out of their workflow.

    DISC Pie Chart

    Conscientiousness

    The last personality trait in the DISC method is the C, which stands for Conscientiousness. According to extendeddisc.org, this style of people makes up about 31% of the worldwide population.

    C-style people tend to be very detail-oriented. Often asking “Why” questions, this style will often be deliberate and methodical when solving problems and is comfortable spending hours analyzing large amounts of data to solve the aforementioned problems.

    Analytical and precise by nature, C types are at their best when they can work independently and focus on problem-solving. Common positions for C personality types are data scientists, software engineers, financial analysts, and software developers.

    As an SEO agency, Search influence frequently works with C types. Our experience has taught us that to provide detailed reports and facts in advance so they can process the information. We have also found that during a meeting with C types, it’s best to follow a specific agenda (which is always sent ahead of time) and to reference and maintain project trackers. This allows them to gather details and process the tasks at hand.

    Tailoring Your Metrics Based on DISC Type

    The experienced Search Influence team tailors our metrics based on our stakeholder’s DISC type. We find this helps us select the right metric to focus on when communicating our marketing plan to our clients.

    For example, C style personalities may care about those micro metrics and higher funnel metrics, whereas D types are more likely to care about lower-funnel metrics. As such, when we are communicating with a D type, we focus on conversion-based data.

    Improve Communication with Stakeholders and Teammates through the DISC Method

    On our team, we find it can be impactful for interpersonal relationships to understand one another’s DISC profiles. Search Influence is an SEO company and digital marketing agency with years of experience using the DISC methodology to improve client communication and relationships—and we use it internally to work more efficiently and effectively for our clients.

    We believe the DISC Workplace Profile Assessment can help companies to differentiate personality types and understand the preferences of others when connecting in the workplace. Learn how Search Influence can help you craft a results-driven digital marketing campaign with assistance from the DISC methodology.

    Images:

    People working in a boardroom

  • Search Influence Sees Double with 2 New Hires

    Search Influence is seeing double with the addition of two new team members! Let’s learn about our newest Influencers.

    Katelyn Mulkey, Sales & Marketing Coordinator

    Born and raised in Abita Springs, Louisiana, Katelyn didn’t go far for college, graduating from the University of New Orleans with a degree in Marketing. Before taking a brief detour, Katelyn worked as a Search Influence Account Manager for almost 3 years. But she realized that an agency is where she really thrives so now she’s back to make her mark on the Sales and Marketing team. When she’s not at work, you can find her out and about listening to live music all around the city. 


    Ren Horst, Junior Digital Copy Editor

    Originally hailing from Madisonville, Louisiana, the Northshore of Lake Pontchartrain, Ren moved to Lafayette in 2016 to pursue their studies at the University of Louisiana at Lafayette. Ren earned their Bachelor’s degree in English and currently is currently working on their Master’s in Communication. Outside of working part-time on the Content team, Ren spends their time as a teaching & research assistant and growing their creative writing skills. 


    Welcome to Search Influence, Katelyn and Ren!

    Interested in joining our team? Check out our open positions!

  • Yes, Your Higher Ed Marketing Agency Needs Developers

    Key Insights

    • Higher education marketers need web developers that understand marketing and can think out of the box to solve problems
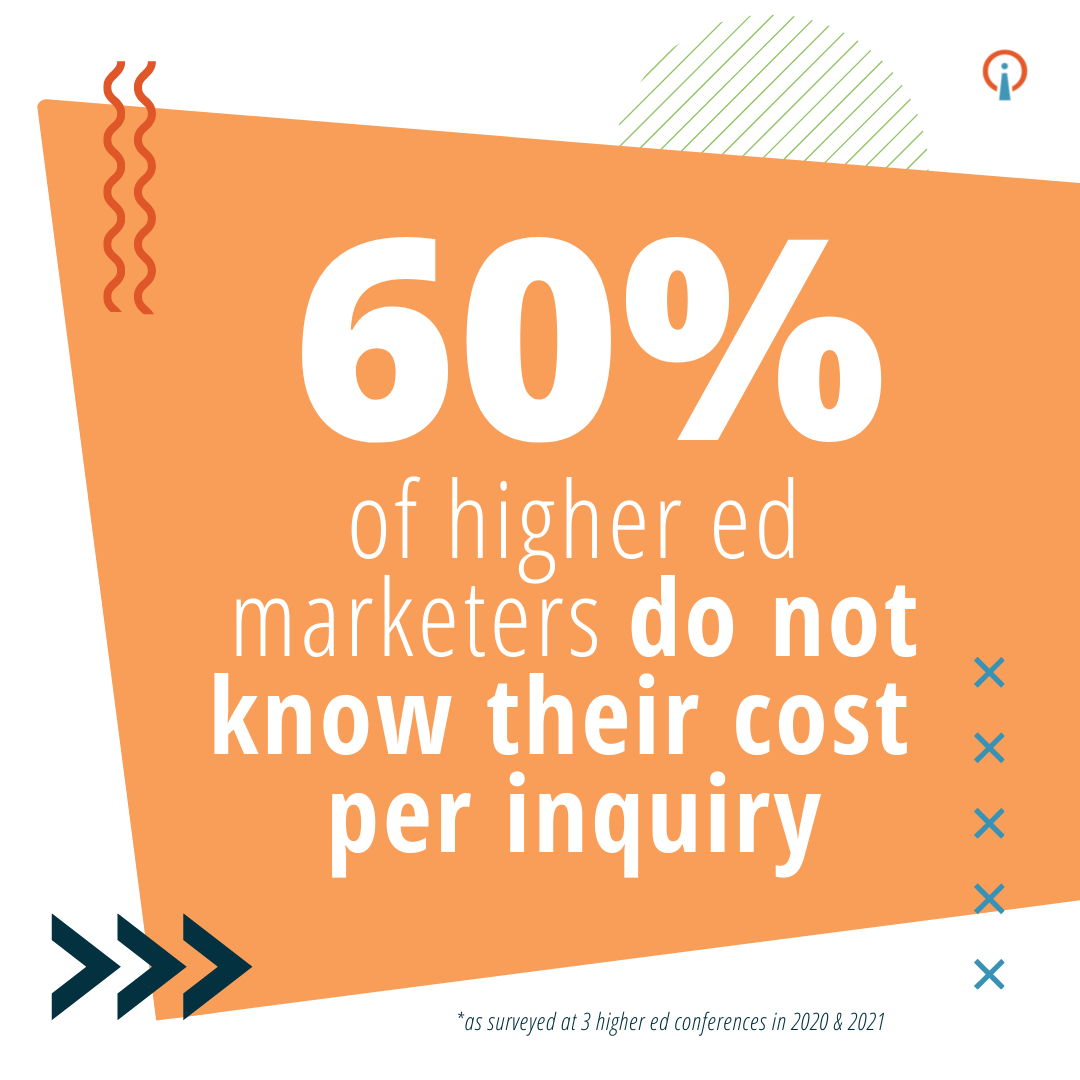
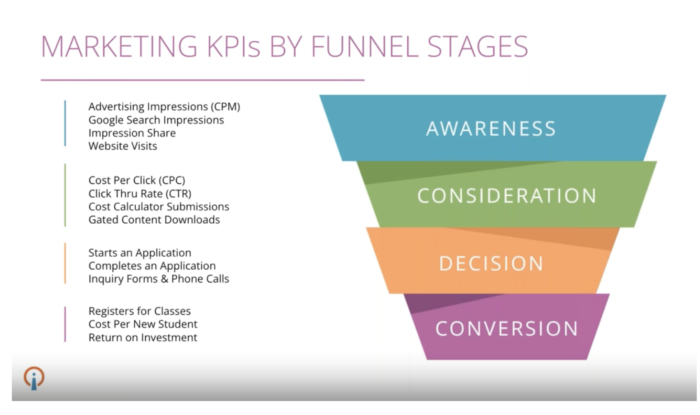
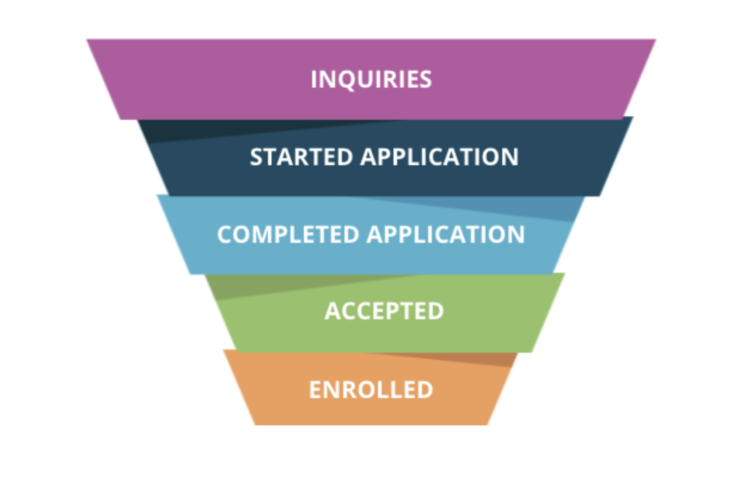
    • To optimize your higher education marketing strategy, you need visibility in each step of the funnel
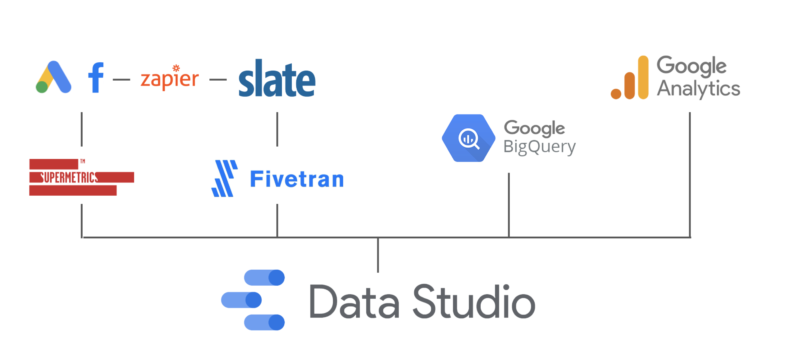
    • With so many disconnected systems, you need a skilled development team to track the student journey and prove your marketing ROI

    Yes your higher ed marketing agency needs developers

    Your Higher Education Marketing Agency and The Student Journey

    It’s not enough to simply create and understand your marketing funnel in today’s world of digital advertising and marketing. You need to plan, track, and earn buy-in through each phase of the prospect’s student journey and react quickly to changes in the market.

    An even bigger challenge is that the vast majority of higher ed CRM software is antiquated and lacks the ability to track prospects as they move through the funnel.

    Whether in search, display advertising, or social media it’s critical that your CRM software can connect the dots.

    With higher education CRMs so lacking, institutions have considerable gaps in their ability to effectively market degree programs to the right prospect at the right time. And it’s especially hard to react quickly to unforeseen changes to the education market.

    This is why it’s so important for you to have a development team—either internal or at your higher ed marketing agency—that understands your unique website and the prospect’s student journey. Although some universities rely on their IT staff, this is usually not enough.

    To ensure you support your prospect’s student journey, you need a skilled development team behind you that understands the technology and the higher ed marketing funnel. With the help of a higher education marketing agency and a skilled development team, you can track your prospective students through the funnel, assuring they’re getting the content they need at every phase until they’re enrolled.

    In this blog post, we will go over why it’s important to track students at every step in the recruitment journey. Your marketing team needs to understand where students get stuck. Then they can create content (case studies, blog posts, videos, and more) so you can optimize your strategy to move them through.

    Inbound Marketing Strategy and Your In-house Dev Team

    Right about now, you are probably thinking, “I’ve got that covered! We’ve got a brand strategy, we get lots of organic traffic, and at my university, I’ve got a built-in development team that manages our university website, including the pages for the program I’m responsible for.”

    And to be fair, your developers are probably amazing at maintaining the university website and keeping your degree pages online and running smoothly.

    But this is not about design and development. It’s about an effective higher education digital marketing strategy. To make your prospective student journey most effective, your development team should:

    • Understand higher education inbound marketing
    • Understand the marketing funnel
    • Know the details of your specifically defined marketing funnel
    • Have experience tracking prospects through the entire student journey
    • Have the skills to help you track the data that informs you if your online marketing efforts provide positive ROI and bring you prospects

    Search Influence is a higher education marketing agency whose development team does all the above on the daily, and it’s exciting!

    Headshot photos of the Search Influence technology and development team

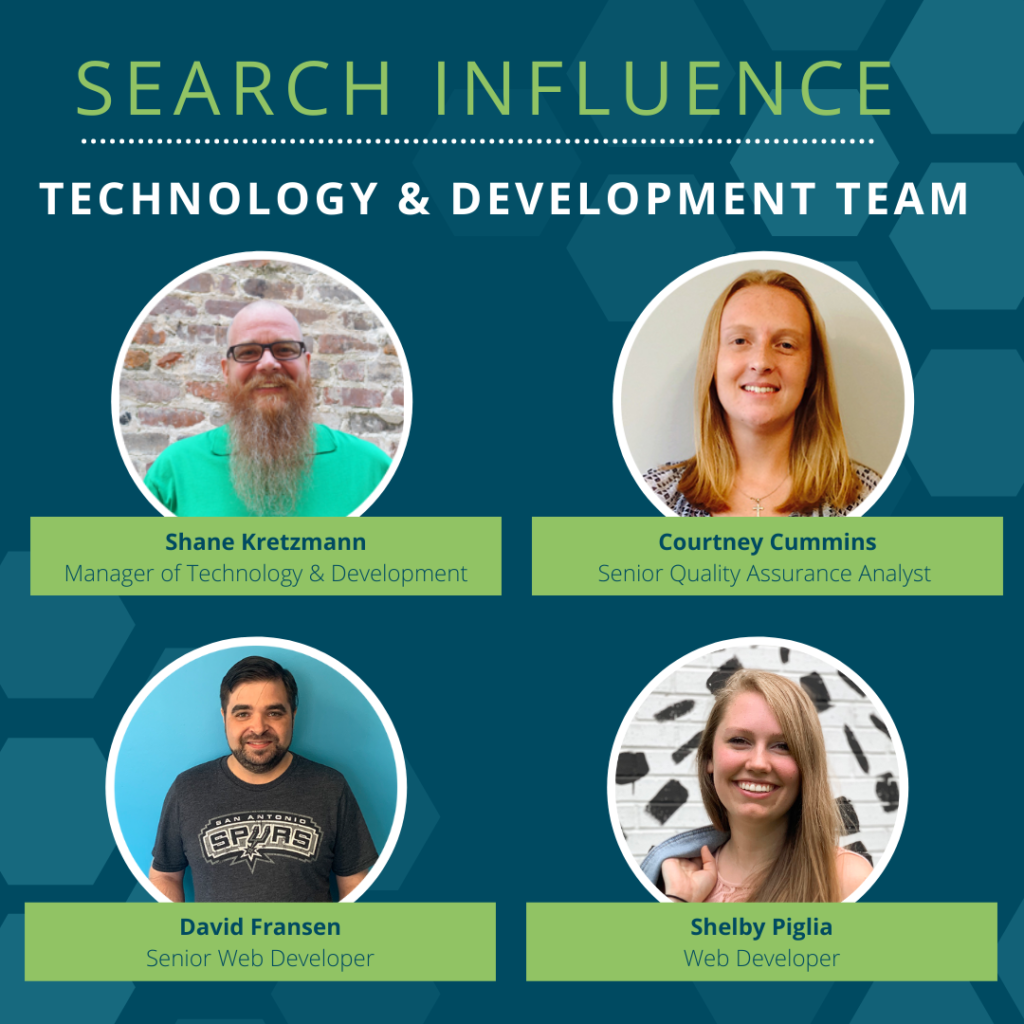
    Our development team specializes in marketing, implementing, and troubleshooting tracking and analytics. We also provide the information needed to ensure you invest your budget wisely.

    We do the things you might typically associate with web development, such as content implementation, updating your website’s look, and adding functionality. As a higher ed marketing agency, we excel at thinking outside the box to get the results colleges and universities need.

    With deep knowledge in tracking and analytics, we can do this in search engines, digital ads, or even [gasp] offline.

    A Real-World Example: How Automating Your CRM Data Entry Can Help You Market Your Degree Program

    Goal & Situation

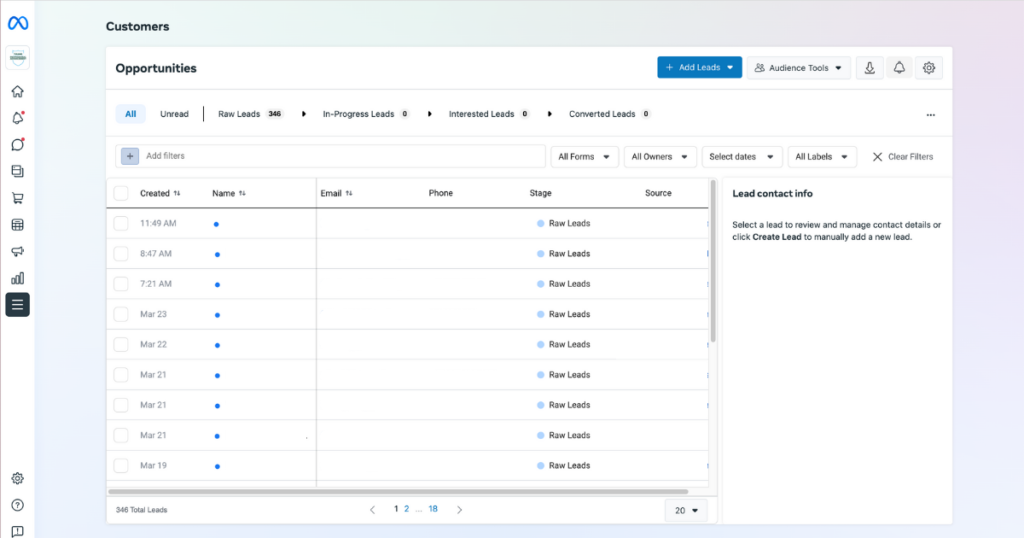
    One of our higher ed institution clients wanted to target prospects on Facebook (aka Meta), but their CRM had no integration options for social media outlets. This meant the data collected in Facebook wouldn’t seamlessly integrate with their CRM.

    Their internal team would have to do a lot of manual data entry work to track the effectiveness of the Facebook campaign and to connect the data obtained to their university CRM software.

    As you can imagine, this type of manual work is time-consuming, prone to errors, and frustrates everyone involved.

    No built-in connection existed between Facebook and the university’s CRM but we knew we could figure out a way to automate this process and give time back to the university’s marketing team.

    Search Influence’s Approach

    At this point, many development teams would simply tell their clients that it would not be possible to automate this process. They are focused on your website, keeping it looking modern, and keeping that CRM running smoothly.

    As a higher education marketing agency, Search Influence has worked on many similar projects to connect data from one source to another. With this experience in mind, we gathered the facts and knew we could solve the problem.

    First thing first, we had to determine if the CRM offered any sort of API that you could push data into. Without a way to push data in, this whole project would be dead in the water.

    In this case, we confirmed that this CRM did, in fact, accept lead information via an API endpoint. But it could only receive the information in a very strict XML format.

    Facebook provides a way to export lead data from Facebook Business Manager.

    Screenshot of Facebook lead center

    Unfortunately, it’s manual and the export is provided in CSV or XLS format. Plus, the data collected on Facebook differed from how the university CRM accepted it in their API.

    For this project, we ended up using the integration tools available at Zapier.com.

    We knew Zapier already had a connector to get data out of Ads Manager, and if you feed it a form id, it can listen for lead submissions. Once the lead is “zapped” into Zapier, we manipulated the data and remapped it to match the expected inputs the university CRM required via the XML API endpoint.

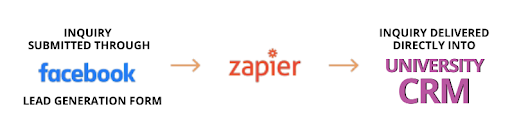
    Once everything matched the university CRMs XML rules, we automatically sent the data. The Facebook lead data became instantly available to the university CRM.

    Result

    We eliminated manual copying and pasting from Facebook to the university CRM, and now the university uses the data collected from Facebook for other efforts.

    We took advantage of their Facebook marketing efforts to set up email drip campaigns to ensure prospects coming from Facebook get the right information they need at the right point in the student journey.

    This is the real benefit of working with an experienced higher education marketing agency with equally experienced development staff. If there’s a solution, we’ll find it.

    The Higher Ed Marketing Experts at Search Influence Can Help!

    This is just one example of how out of the box thinking can help your educational institution’s marketing and communications get the data you need to be effective. If you don’t have confidence your current higher ed marketing agency has the technical chops to manage the challenging world of digital marketing, it’s time for an upgrade! Contact the Higher Education Marketing experts at Search Influence to help you meet your enrollment goals.

  • Why Advertising Costs Spiked in 2021, Particularly in Q4 (and What You Can Do About It)

    Key Insights

    • Advertising costs tend to be higher in Quarter 4 for all industries
    • The iOS14 update in 2021 and the pandemic in 2020 magnified these trends in 2021
    • Plan ahead and anticipate this spike by creating a full-funnel strategy in advance to help offset these costs

    Screenshot of google search console data platform

    As we make our way into 2022, you may be high-fiving your team as you happily report that cost per impression has dropped across your Facebook campaigns, particularly for month-over-month comparisons. While this is exciting to see in the first quarter of the new year, it’s not exactly a coincidence. In fact, it’s actually the result of a trend we see in quarter 4 of the year prior. Q4 is notorious for driving advertising costs to their highest rates of the year. This is an important topic to address because it affects nearly all industries and can negatively affect your bottom line as the year comes to a close. The biggest driver of elevated CPMs during this time is increased competition.

    Starting with Black Friday, more and more marketers are rushing to push their ads live in time for the holidays, meaning more competition and higher advertising costs for you. While this likely doesn’t come as a huge shock, you might be surprised to learn that 2021 advertising costs were particularly high.

    To find out just how high, Search Influence has pulled our internal Facebook data to best answer this question. We have also included three proactive measures to help you plan for and cut these costs down each year.

    Internal Case Study

    In this review, we compared our 18 active Facebook clients, regardless of campaign objective, to the 17 Facebook clients active in 2020 during the same period. The results showed that Facebook cost per impression rose 29.48% in quarter 4 of 2021 compared to Quarter 4 of 2020.

    CPM versus year in quarter 4 2020 versus quarter 4 2021

    The results were even more drastic in December. In December alone, CPM rose 43.07%!

    December data for CPM versus year for December 2020 against December 2021

    For our higher education clients, in particular, we saw even more fluctuation. In quarter 4 of 2021, Higher Education CPMs rose 49.51% compared to the year prior.

    CPM comparison from Q4 2020 to Q4 2021

    And in December alone, CPMs grew 72.13% for this industry compared to December 2020.

    December only higher education CPM versus year data

    But, Why 2021?

    The most likely culprit is the iOS14 update that went into effect earlier in the year. Now that privacy is under the magnifying glass, Facebook has to revamp. Retargeting and Lookalike audiences are largely unavailable or tanking in performance due to most iOS users opting out of tracking. The result? Much smaller retargeting audiences.

    Additionally, Lookalike audiences, which come from Pixel data, aren’t being tracked the same way. Therefore, the data source for much of your Lookalike audience quality has been falling, and performance will suffer as a result. In sum, your ads are targeting a broader audience than before. Add that with the seasonal trends we see in Q4, and what do you get? Record high CPMs.

    Lastly, 2020 was a truly difficult year for everyone. As companies made cuts across their business, advertising budgets were often the first item on the chopping block. If you could keep your advertising campaigns running during this time, you might have been pleasantly surprised by the reduced competition. Now that the world is growing more and more accustomed to the new “normal” in light of the pandemic, companies can get back in the marketing game, and boom, competition is back, as are high CPMs.

    So What Does This Mean for You and Your Industry?

    Higher CPMs are here to stay, and you can expect them to be the highest towards the end of the year. The biggest spikes will likely hit in November and December, beginning around Black Friday.

    At Search Influence, we recommend the following strategies to help you counterbalance the increased costs in the final quarter:

    • Plan and execute a full-funnel strategy
      • The best way to prepare for this is to be proactive about your advertising strategy and plan at least six months in advance again. We would recommend allocating additional budget towards the end of the year to help compensate for the seasonality OR start running your campaigns earlier to ensure your ads are out of learning and optimizing towards your goals before the holiday rush hits. Beginning early in the year with a brand awareness strategy that leads into a conversion or lead generating strategy closer to the busy season allows users to grow familiar with your brand before it’s time for them to convert.
    • Create early incentives
      • Another strategy we recommend would be to set initiates for users to convert early. For example, an education client might waive an application fee if submitted before November 20. Likewise, an eCommerce click might benefit from offering an early bird promo code to encourage shoppers to purchase before marketing costs surge.
    • Increase awareness with high-quality video assets
      • Using video assets is an excellent way to improve performance. They almost always outperform static images, and 81% of customers decide to buy a product or service by watching a brand’s video content. Videos are also a great tool because you can use them to remarket to users that have viewed them before.

    Failing to plan ahead of this seasonal push could have a detrimental impact on your business. At Search Influence, we believe it is essential to build a full-funnel strategy throughout the year that can help you with most of your marketing budget. Reach out to our expert team at Search Influence to find out how you can improve your marketing strategy today!

    Images

    Search Console

  • Search Influence Certified as a Women-Owned Business

    Headshot photo of Search Influence COO Angie ScottThe Women’s Business Enterprise National Council (WBENC) has certified New Orleans-based digital marketing firm Search Influence as a women-owned business. In 2021, Search Influence COO and co-founder Angie Scott became a 51% owner of the company. To achieve certification, the WBENC validates that a business is at least 51% owned, controlled, operated and managed by a woman or women.

    As COO, Scott manages Search Influence’s day-to-day operations and ensures they align with the company’s long-term goals. Additionally, she plays a leading role in the company’s quarterly and annual strategic planning and oversees short-term and long-term resource management. Scott co-founded the company with her husband and Search Influence CEO Will Scott in 2006 and the company now has a dedicated team of 30 in-house employees that collaborate with hundreds of clients nationwide.

    “More than 80% of Search Influence’s team members identify as female, with five of six executive team members identifying as female. To reflect the makeup of the company and recognize the critical role Angie plays in our success, we felt it is important that she became the majority owner of Search Influence,” said Will Scott.

    According to the WBNEC, the U.S. has more than 13 million women-owned businesses, representing 42% of all businesses.

    “For years, I’ve had the pleasure of working with a team of exceptionally talented women. To be officially recognized as women-owned and women-led is an honor I’m excited to share with them,” Angie Scott said. “Our focus on SEO, paid online media and analytics make us both a technology and marketing firm. As frequent speakers and presenters, our team takes pride in demonstrating technical excellence in traditionally male-dominated venues.”

    Women’s Business Enterprise National Council (WBENC) certified business logo

    The WBENC is a leading non-profit organization dedicated to helping women-owned businesses thrive. To become WBENC-certified, business owners undergo a thorough vetting process, including review of business documentation and a site visit. Through certification, women-owned businesses gain access to a vast network of support, including targeted business opportunities for certified women-owned firms, increased visibility in corporate and government supply chains, education and development programs to spur growth and increase capacity, and networking and mentorship opportunities with thousands of women entrepreneurs and those who support them.

  • 4 Steps to Demonstrate the Value of Your Higher Education Marketing Strategy

    Key Insights:

    • Define relevant SMART goals for your marketing strategy to provide clarity on the results you want to achieve.
    • Utilize research-backed data to demonstrate how your campaign’s messaging and platforms help reach your target demographic.
    • Tailor your presentation to your audience to convey how your strategy helps each stakeholder reach their unique goals.

    A person making charts and graphs on a computer

    After you’ve created your marketing plan, your next step is to present your strategy to key stakeholders to demonstrate how it will improve the organization’s results. Effectively presenting this information is essential for gaining stakeholder trust and aligning your organization’s goals. In this post, we will outline the four-step formula for demonstrating the value of a new marketing strategy.

    #1: Share Your Goals

    Discussing the goals of your campaign allows stakeholders to visualize the end result of your higher education marketing strategy and understand the expected returns. Furthermore, sharing your goals conveys you have thoroughly examined how this plan impacts the organization.

    When sharing goals, focus on quantitative measures primarily, but don’t forget to bring in some qualitative measures to show the whole picture. Start by defining important qualitative goals, and then turn these into more tangible measures by adding quantitative metrics. These goals should be SMART: specific, measurable, achievable, relevant, and time-bound. SMART goals clarify what results you are trying to achieve and the time frame you aim to achieve them.

    After defining these goals, let your stakeholders know how often you will update them on your progress. This will keep you accountable to the measurement of your performance and lets your stakeholders see your commitment to achieving results.

    #2: Relate Your Goals to Your Target Demographic

    After you have defined the goals of your marketing strategy, it is essential to demonstrate how these goals impact your target demographic. This helps you convey to stakeholders how this direction aligns with your organization’s goals. To demonstrate this, start by researching industry data on the demographic makeup of the platforms your campaign is utilizing.

    The good news is that you can find an abundance of reliable data on the demographic makeup of popular social media platforms in the age of digital marketing. Knowing where your target demographic is consuming information can aid you in conveying the power of your higher education marketing strategy and stay ahead of the curve. For example, here are the largest age groups on major social media platforms:

    You should also research how much time your target demographic spends on each platform. This will allow you to determine how effectively your marketing strategy will reach these users. For example, 20% of Gen Z spends more than 5 hours every day on Tiktok. This data can convince stakeholders that TikTok can be a very effective platform to reach Gen Z due to its high engagement with that demographic. Take a look at this breakdown of the average time spent per day on each popular social media platform:

    • Facebook: 38 minutes per day
    • Instagram: 29 minutes per day
    • Twitter: 3.53 minutes per session
    • TikTok: 45+ minutes per day

    Including this demographic information while presenting your strategy allows stakeholders to understand the effectiveness of this plan. Additionally, showcasing these key statistics helps gain stakeholder buy-in and aids in preparing you for any potential objections.

    During a strategy presentation, use this research-backed data to justify the messaging of your campaign. You can use this data to explain what challenges your target demographic faces and how your messaging drives conversions.

    For instance, let’s say you are a higher education institution trying to reach Gen Z students applying to college. You do research and find that 67% of Gen Z students indicate their top concern is being able to afford college. Using this data, you can adjust your campaign’s messaging to speak to this concern. You can convey this by highlighting your programs’ affordability or by providing resources on applying for financial aid.

    Then, when demonstrating the value of your marketing plan, make sure to include these key statistics that helped you determine your target consumer’s needs. Presenting research-backed data that supports your campaign’s platforms and messaging can help gain stakeholder buy-in.

    #3: Compare and Contrast to Your Current Strategy

    When you present a new marketing plan, you must emphasize why the current strategy doesn’t meet your organization’s goals. Comparing and contrasting it with your proposed tactics will clarify the necessity of a new approach.

    To compare and contrast with your current strategy, pull data on which audiences your current campaigns reach and what results it has achieved. You can do this by looking at Facebook, Google Ads, and Google Analytics campaign results. Use this data to highlight where your current campaigns fail to meet your goals and reach your target demographic. Then, emphasize how your proposed strategy will fill in the gaps and deliver more results for your organization. You can convey this by using research-backed data and SMART goals to demonstrate to stakeholders the results you expect with this new campaign.

    #4: Tailor Your Presentation to Your Audience

    Depending on who you are presenting to, it is beneficial to make slight adjustments to how you explain your strategy and what data you bring to support it. Different stakeholders have unique needs and interests, and tailoring your presentation assists you in conveying how this higher education marketing strategy will benefit them in particular. Furthermore, your stakeholder’s personality can help determine the most successful approach. Using personality assessments like the DISC method can help you understand how best to reach different personality types.

    Be sure to tailor your metrics depending on the different stakeholders you are talking to. Tailor the data you include based on what is most important to your audience and the funnel stage of your campaign.

    For instance, different stakeholders may respond better to macro or micro metrics. Macro metrics are actions that directly contribute to the primary objective of your campaign, such as cost per enrollment and return on investment. Macro metrics are useful when presenting to stakeholders that may not be as familiar with marketing terms and are more invested in the overall picture. On the other hand, micro metrics are secondary conversions that support the overall goal, such as cost per click and click-through rate. These metrics are more likely to be effective when presenting to stakeholders with marketing experience.

    In addition, the stage of the marketing funnel you are targeting will help determine which metrics to present. For instance, awareness campaigns might focus on metrics such as website visits and impressions, while conversion-focused campaigns are more suited for tracking metrics like return on investment and cost per new student. By tailoring the data and messaging in your presentation to each audience, you can more effectively communicate how your plan will drive results by using language your audience is familiar with.

    marketing KPIs by funnel stages

    In order to gain stakeholder trust in a new higher education marketing strategy you should define goals that align with your target demographic; compare these to your current strategy, and tailor the presentation to your audience. By following this guide, you can use research-backed data and targeted messaging to convey the value of your marketing plan to any stakeholder.

    To learn more about how Search Influence handles higher education marketing strategy, fill out a form to get access to our on-demand webinar series.

    Images:

  • How to Use Quantitative Data in Your Higher Ed Marketing and Recruitment

    Key Insights:

    • Having some shared form of internal communication between all departments improves workflow for everyone
    • By identifying user touchpoints, you discover opportunities that can improve the quality and/or quantity of your data
    • There are tools and platforms available to you to help visualize your quantitative data for easier digestion

    Businesses within the higher education category hold a selling proposition not commonly found amongst other industries. Enrolling in a higher education institution gives consumers something both intangible and invaluable—a well-rounded set of knowledge and enhanced values. This makes it that much harder to find the right target market, especially for institutions within specialty fields of study.

    Quantitative data allows businesses to identify and feed into their target market, finding new opportunities to improve the student experience at every point during their enrollment journey. According to Attomdata, companies with a focus on data-driven marketing notice a 75% increase in consumer engagement over time. It improves the workflow of all teams involved and acts as a connector between every department, regardless of their end goal.

    In this post, we will cover how you can properly utilize and sort all the recruitment data you’ve acquired (no matter how big or small) to improve results for your higher education clients.

    The 3 Key Data Challenges in Higher Education Digital Marketing

    • Silos within the university: Marketing, enrollment, and administration departments have their own separate systems they use to operate in their day-to-day functions, as opposed to having a shared language between one another
    • Data in disparate systems: Having too much or little data pushed through systems that are not capable of utilizing its full potential
    • Inability to connect data: Struggling to connect data to the different stages throughout the student journey funnel

    These challenges strip the value from collected data and prevent other useful data from coming through. This, in turn, makes the jobs of every involved team member more difficult while also decreasing the number of qualified leads that may have otherwise made it through.

    What to Do With Limited Data

    When there aren’t enough touchpoints identified in the student recruitment process it makes it nearly impossible to offer any recommendations for developing your higher education digital marketing strategy. This funnel is a great visualization of the touchpoints a typical student reaches throughout their enrollment journey.

    Marketing funnel for higher education

    Visualizing Your Funnel

    Make an effort to visualize each step of your prospective students’ journey, from the moment they show interest in your institution via form submission to the point they decide to enroll. Segment the data to fit each respective step in that student’s journey. If you haven’t already, make sure to create a buyer persona of your institution’s ideal student so that you have a solid base to work from.

    Considering what students think about at different points in the process will help reveal ways to make that journey more seamless. For example, when students inquire about a semester, the actual period they plan on attending tends to differ from the time that they reach out. To accommodate that, we add semester-specific questions to university inquiry forms to offer information that’s relevant to their intended enrollment period and, therefore, more relevant to them.

    What to Do With Too Much Data

    Sometimes marketers receive a large influx of data with no established method for sorting it. This data can hold value–it just needs to be served to the right team. Breaking the data into easy-to-understand KPIs (key performance indicators) helps us understand it and determine which departments would best benefit from what information.

    Micro Marketing Metrics

    These metrics speak most directly to those working in marketing-focused teams:

    • CPC (cost per click)
    • CPM (cost per 1,000 impressions)
    • CTR (click-through-rate)
    • IMP (impressions)
    • IS (impression share)

    Macro metrics are ideal for those working on other teams like enrollment and administration:

    • CPI (cost per inquiry)
    • CPA (cost per application)
    • CPE (cost per enrollment)
    • CPA (return on investment)

    Communicating the Story of Your Data to Stakeholders

    To effectively report your results to fellow stakeholders, it is vital that you break down those silos that each team uses by finding a common point for all to connect at. In a recent online poll given during a Search Influence webinar, only ”… 20% of registrants indicated that they “can clearly see/demonstrate the correlation between marketing & enrollment.” This tells us that a serious information barrier exists between the two teams, where there should be a collaborative relationship.

    Connecting gives everyone the chance to step back and see the bigger picture of what your data does/how it works together for every team’s benefit. This can be done through something as simple as a weekly marketing meeting, ensuring everyone is on the same page. Frequent meet-ups will give stakeholders unfamiliar with marketing standards a chance to become more acquainted with relevant terminology.

    From there, determine all the different touchpoints that your potential students may encounter. This will reveal gaps in between conversions from which more valuable data can be discovered. Then you can figure out how to best extract data from those points to better serve your future students and stakeholders. Finally, collect that data as it rolls in and take advantage of its full potential! When you analyze it correctly, data can reveal user experience problems, internal dilemmas that a student may face at a given stage, and much more. This leads to a world of possibilities that could help create a more friendly, seamless experience for your future students.

    Tools to Support Visualization

    At Search Influence, we utilize Google Data Studio (GDS) to present quantitative data to our clients and fellow stakeholders. GDS is a great tool that can pull data from various platforms. We use several data tools such as Google Analytics, Facebook, Zapier, Google Big Query, Google Ads, and Slate. GDS visualizes that data for easier digestion between departments and clientele!


    tools for google data studio integrated reporting

    Of its many features, GDS allows you to view your conversions through every touchpoint, by channel (organic search, Google paid search, Facebook ads, etc. ), so that you can identify the best performing channels and improve the others. With many of these platforms, you can generate KPIs automatically based on past data and later edit for easier view in Google Data Studio. Google Analytics, a website-analytics monitoring platform, is a free and popular method of sorting a business’s data, and it’s on the rise.

    A recent article done by Marketing Evolution states that “…As of 2020, the use of analytics in marketing was(at) 52.7 percent.” In addition, reporting platforms like GDS let you view your acquired leads by location, which can be used by recruitment teams to decide where to campaign next and to find the most promising areas for building-up referrals. Each business is different, so while you may not have a use for all the previously mentioned platforms, we recommend trying a few to find the ones that work best for your institution. What’s most important is having an understandable and accessible method of viewing quantitative data for all stakeholders.

    To wrap it up, there are methods and tools available to assist marketers in the collection, sorting, and analysis of quantitative data. Quantitative data is irrefutable proof of whether or not your strategy is working well for your target market and how you can go about enhancing their enrollment experience. When you implement common language amongst all teams, real discussions start to happen, making the end goal for increased conversions a team effort and, therefore, much less intimidating. Gain more control over your institution’s performance by applying this advice and taking advantage of these widely-used tools. Your next big breakthrough is only a few clicks away!

    Need help using your quantitative data to support your higher education digital marketing strategies? For over 15 years, we have been helping businesses collect and analyze data to create real-world results. Contact Search Influence today to fill out a form to get access to our on-demand webinar series.