Tag: infographics

  • The Rise of the Silver Surfers: Engaging Older Americans Online

    Mini Infographic Silver Surfers Older Americans Month - Search Influence

    In honor of Older American’s Month, let’s take a look at the latest trends and talk about engaging this audience!

    “So, who exactly is considered an older American?” you might ask yourself. Well, based on the Older Americans Act of 1965, you could say anyone over 60, basically Baby Boomers and older. These are the people who were working in businesses and actively using technologies like PalmPilots and beepers/pagers during the early stages of the rapid technology growth in the 20th and 21st centuries. You may have also previously heard the term “silver surfer” used to refer to anyone over the age of 50 who is an avid internet user.

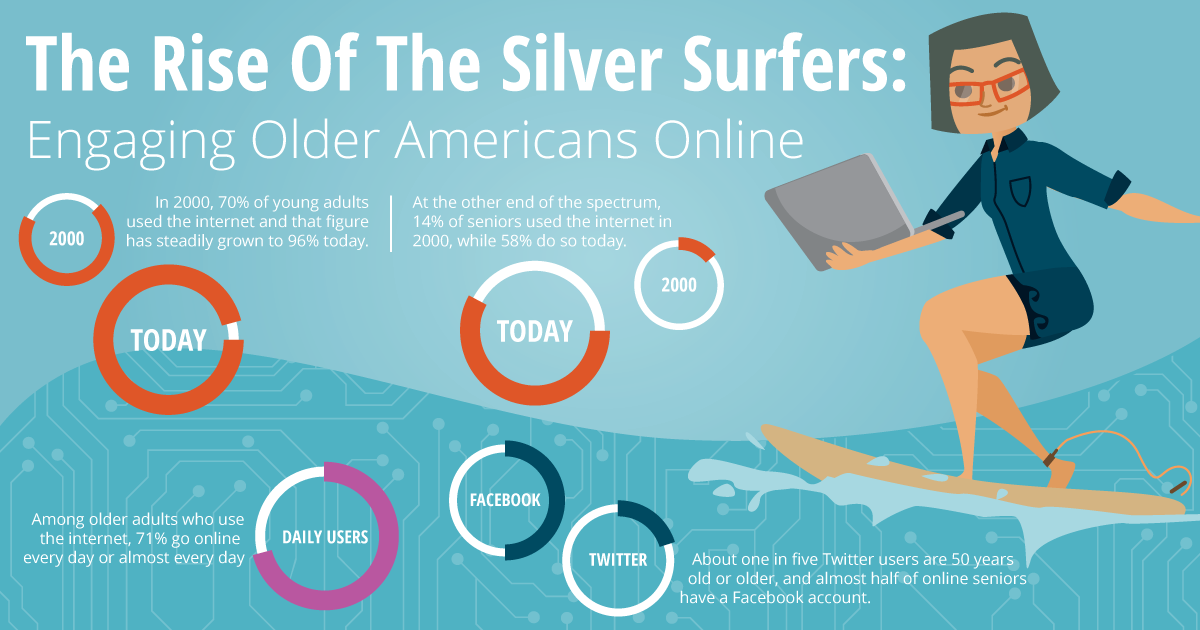
    According to 97 surveys conducted by Pew Research over the past 15 years (2000-2015), internet usage gaps between older and younger Americans still persist, though they’re lessening. Now about six in ten seniors go online. While adults 65 and older rank the lowest in internet usage between age groups, the number of older Americans online has grown in the past 15 years and will continue to grow in the coming years.

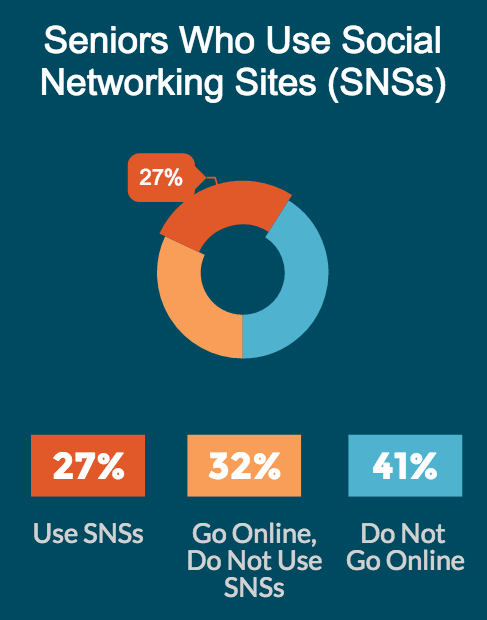
    Another report from Pew Research digs deeper into technology usage trends by analyzing seniors within their age group. Among the older Americans who currently go online, about three-quarters of them go online every day. Just over a quarter of seniors use online social networks.

    The Stat:

    “Older adults have lagged behind younger adults in their adoption, but now a clear majority (58%) of senior citizens use the internet.” — Pew Research Center

    What It Means for Marketers:

    While the previous usage numbers and perceptions would’ve indicated to online marketers that the older age groups aren’t very active online, that is definitely no longer the case. As of 2012, more than half of the senior population is online, and you can bet that number will continue to grow. The silver surfers are now an important and very present audience to consider when marketing online.

    The Stat:

    Seniors have the largest adoption rate change from 2000 to 2015 of any age group (14% to 58% respectively). — Pew Research Center

    What It Means for Marketers:

    This rapid increase in adoption rates shows an increase in technological intelligence among this age group. The previous parallels between chronological age and cognitive age are shifting and advertisers would do well to adjust accordingly. While practicing “ageless” marketing is all well and good, when trying to target this specific audience, be authentic and thoughtful of “the new 65,” a more-tech savvy and a now younger cognitive age group.

    The Stat:

    77% of older adults have a cell phone, but just 18% are smartphone owners. — Pew Research Center

    What It Means for Marketers:

    As many of you reading this know, mobile marketing is quite the focus of today. While a little less than a quarter of older adults have smartphones, over a quarter own tablets or e-book readers. This means that mobile searching and browsing is highly likely for this audience. Consider your potential to reach these seniors when optimizing your website and its content.

    Seniors Older Americans Online Using Social Networking Sites - Search Influence

    The Stat:

    “Today 46% of online seniors (representing 27% of the total older adult population) use social networking sites such as Facebook.” — Pew Research Center

    What It Means for Marketers:

    These silver surfers aren’t just surfing the web; they’re socializing, too! About one in five Twitter users are 50 years old or older, and almost half of online seniors have a Facebook account. Engage with the older American audience to help grow your brand online.

    Biggest Takeaway:

    When you think older Americans, you shouldn’t think, “my grandma who makes me fix her Wi-Fi router and doesn’t understand smartphones.” Instead, think of the generations before you who were in their prime for the technological boom that gave us the first cellphones, computers, and video games. These generations were the first to experience technology and were fortunate enough to grow and adapt with it. So, in reality, they’re part of your market and audience whether or not you realize it. The silver surfers are here and growing, so don’t discount them when you’re planning your marketing campaigns!

    All data and stats came from the following sources:
    http://www.pewinternet.org/2014/04/03/older-adults-and-technology-use/
    http://www.pewinternet.org/2015/06/26/americans-internet-access-2000-2015/
    http://blogs.forrester.com/gina_sverdlov/12-06-08-the_data_digest_digital_seniors

  • 3 Ways to Present Share-Worthy Visual Content

    Content is the reigning king of the marketing world, but the way that content is presented can be instrumental in its success. The most well-written, interesting article won’t do very well if it’s a long block of text. We live in a very visual world, so companies and marketing experts are finding that visual content is actually out-performing its less attractive counterparts. These are three ways you can present your content in a visually stimulating way to appeal to your audience base.

    Infographics

    Studies have shown that infographics can increase traffic to your website or social media accounts by up to 12 percent. These creative tools allow you to convey a lot of information in an attractive, readable way. From charts to illustrated timelines, infographics can be used in a variety of ways in any number of industries. You can present research findings, how-to guides, and even more traditional documents like annual reports in the form of infographics. You’ll find that your audience is far more likely to engage with your content if it’s communicated as visual information, resulting in a broader reach and an easier transfer of data.

    new orleans festivals 2015 infographic

    Annotated Image

    Annotated images often take the form of inspirational quotes over attractive stock photos, but this media form can actually be used to communicate information. Consider statistics. Statistics are very shareable bits of data, but unfortunately, they’re often presented in a way that isn’t visually appealing. Don’t give your audience a bulleted list—present them with one statistic over a creative, relevant image or background color that matches your branding. These images are easy to digest and share, and they draw attention to your company’s mission without the heavy-handedness of an advertisement. Your annotated images can link to blog posts or internal pages on your website, or they can simply be a part of a series you regularly post to social media.

    Shoppers Searching Image - Search Influence

    Picture-Rich Blog Posts

    The way we blog or post articles has changed at a frighteningly slow pace, and is often counterintuitive to the way readers engage with our content. A tiny picture in the left-hand corner and large blocks of text simply don’t cut it anymore. Redefine the way you think about blogging. Break up your posts with full-sized, sharp images. If you don’t have your own pictures of the subject matter, high-quality stock images can be just as engaging and eye-catching. Shorten your paragraphs to a sentence or two, and use bold text to emphasize numbers and statistics. Simply put, make your blog posts highly visual and easily scan-able.

    By sharing information as an infographic, annotated image, or a photo-heavy blog post or article, you can outplay the average consumer’s waning attention span. If your content is great, present it in a way that will be noticed.

    Image source:

    Premier Allergy

  • Healthy Content: 4 Tips to Drive Conversions in the Medical Industry

    Healthy Content Marketing Image - Search Influence

    In the medical and plastic surgery industries, it can be hard to get past the medical jargon and engage with readers online. But despite these challenges, building up an online presence is vital in this day and age. Everyone online wants to gather information quickly, and they seek immediate gratification when it comes to scheduling appointments and learning about procedures. To keep their interest, you have to present your content in a user-friendly, engaging and attractive way. Let go of the olden days of long-winded explanations and paragraphs upon paragraphs of medical terminology that no one can understand. Step into the 21st Century with these four types of content:

    1. Infographics

    We all want something that is nice to look at and easy to understand. Infographics are not only engaging, but they can also be super informative! The medical terminology that your current and prospective patients need to know can be easily explained in shorter phrases and pictures or guidelines. Infographics help your patients connect with you and your practice.

    Infographics are also more likely to be shared by your customers. People love sharing fun and interesting infographics on their own social media pages, so this will ensure more conversions and potential new clients! Find out more about how infographics can give your content marketing strategy a facelift.

    2. Videos

    Videos are another great visual way to engage your website visitors. You could explain your processes and surgical procedures easily without scaring visitors off with long, complicated paragraphs. This is also a great way to introduce yourself and your practice to potential patients.

    You don’t have to do a stand-up; you could make a slideshow video with voiceover narration, or if your budget allows, an animated video. Make sure you include a call to action at the end so the viewer can take the next step in becoming a patient!

    3. Lists

    Lists are great. You’re reading one now! Putting the number of listed items in the title is especially helpful so people know exactly what they’re getting into. Readers are more likely to click through and take the time to read if there are 10 or fewer items. They’ll think it will only take a couple of minutes, then BAM! They’re hooked. They’re converting, and they’re your next patient!

    Make sure to write lists that are interesting and preferably not common knowledge, such as “10 Things You Didn’t Know about ____” or “5 Ways to Look Younger Without Surgery.” You could even promote your products or services with a list of great products for this, that, or the other thing. Keep it short, sweet, and to the point.

    4. Guides

    Because you specialize in a certain medical field, you have knowledge that is credible, useful, and interesting. Write it down! Guides can be about absolutely anything, and they’re excellent sharing material for those who want to stay informed and keep their social media followers/friends informed. For an example, check out the Search Influence guide on how your online presence can win and lose patients.

    An excellent way to drive up conversions is to make your guide a downloadable file and request information from the reader before they can download. This allows you to add them to your email newsletter list, which will make them more likely to become a patient in the future.

    Deciding how you want to present yourself online can be time-consuming and frustrating, but these four winning types of content are fun, engaging, and can help your conversion rates. Play around with some ideas and be sure to use different content on different pages to keep people wanting more!

    Interested in more content marketing tips for medical marketing? See how natural content can help your practice’s website attract patients.


  • Show Me An Infographic, Mister! New Orleans’ Unique Content Marketing Approach

    There’s definitely a story behind New Orleans—the city of festivals. And it’s an insider story you likely haven’t seen online before. For example, what New Orleans tradition includes 822 floats and is 21,000 riders strong? What celebration features more than 130 pyramids of burning logs? When it comes to content marketing, New Orleans gives tourists and locals alike reasons to share the kind of fun, behind-the-scenes information that makes the Big Easy one of the world’s most fascinating cities. In a city steeped with so much history and culture, infographics are helping to bring some of the key celebrations—such as the recent New Orleans Jazz & Heritage Festival and Mardi Gras—to life through visual storytelling.

    A City of Festivals Comes to Life

    The New Orleans Tourism Marketing Corporation enlisted the help of Search Influence and its creative infographics team to reinforce the city as a year-round destination where there’s always something happening. Yes, it’s true: there’s virtually always a parade, festival, second line, or other event every week. And along with the big-name festivals like the New Orleans Jazz & Heritage Festival, French Quarter Fest, Essence Music Fest and Voodoo Festival, there are many other celebrations that lend to the city’s reputation for being among the most diverse festival cities in the world.

    In fact, New Orleans is deep in its festival season now, and this infographic gives the story in eye-catching detail—in a way that just plain old written content can’t match. Check out the part that describes summer festivals in New Orleans:

    new orleans festivals 2015 infographic

    See the Magic of Legendary Mardi Gras

    This February, another Search Influence-produced infographic detailing the legendary New Orleans Carnival—a tradition that dates back to the city’s first Mardi Gras parade in 1837—helped bring renewed interest among people that visited the official New Orleans tourism guide website. While visitors to the website typically spend an average of two minutes browsing, visitors to the Mardi Gras infographic page were spending upwards of eight minutes reading the content. On social media, the infographic was shared more than 700 times on Facebook and Twitter. In fact, the infographic received 6,000 views in its first week. Here’s a glimpse of part of the infographic:

    Infographic Content Marketing Image Search Influence

    What Makes a Good Infographic?

    While content marketing is certainly taking off in New Orleans with lots of local flavor mixed in, all businesses—no Jazz Fest or Mardi Gras required—can learn infographic best practices from these New Orleans examples.

    When crafting an infographic, follow these four tips:

    • Include impressive or interesting statistics that draw readers’ engagement. For example, the average Mardi Gras float in New Orleans is 50 feet long and weighs 10 tons—the weight of two elephants!
    • Make sure the infographic is very graphics heavy. Include images and charts to show your audience the story. That streetcar with “Stellaaaaa” amplified by a megaphone really illustrates the best-loved play that pays tribute to one event: the Tennessee Williams New Orleans Literary Festival.
    • Include an element of usefulness. For example, with more than 70 different parades during the Carnival Season, it can be hard to keep track and determine which ones to attend. For example, the handy “Noteworthy Parades” section of the Mardi Gras infographic doubles as a useful calendar, and the key to the festivals infographic, for example, is to showcase the festival—or multiple festivals!—for every season theme.
    • To finish, craft all of your data and graphics into a visually appealing design. The Mardi Gras infographic, for example, makes use of the vibrant and traditional purple, green, and gold colors as well as a few bold fonts to form an appealing connection between all of the information.

    With these tips on creating the best infographic, keep in mind that the goal with this graphical content is typically to generate website traffic, backlinks, and social shares. And with Facebook and other social media sites putting more and more focus on visual content, it is a safe bet that infographics are not dead. In fact, these Big Easy examples demonstrate further that infographics should be a part of a company’s content marketing strategy.


  • How Infographics Can Give Your Online Strategy a Facelift

    Infographics Facelift Image - Search Influence

    No industry knows the importance of image more than plastic surgery. Before and after pictures are worth a thousand words, and prospective patients heavily rely on visual information derived from those pictures when deciding which cosmetic procedures to explore. However, plastic surgery websites do not have to restrict themselves to just pre- and post-op imagery.

    Introducing Infographics

    Simply put, infographics are images that visualize information or data in a compelling, creative, and colorful way.

    Businesses are increasingly turning to infographics to present their industry contributions. For example, Web company Unbounce, estimates that the use of infographics has seen a huge surge in recent years—an 800 percent increase from 2010 to 2012. Research conducted by AnsonAlex, a tech company specializing in producing tutorials, found that publishers with ample infographics grow website traffic 12 percent faster than those with no infographics.

    Infographics are clearly more than a passing trend; they are a strategic marketing opportunities upon which the plastic surgery industry can capitalize.

    Infographics Make Eye-Catching Websites

    If you are looking for a new way to promote your plastic surgery clinic’s webpage, infographics are a surefire strategy for keeping eyeballs glued to your site. A single infographic has the potential to reach as many as 15 million Internet users through web searches, according to an infographic by Top Marketing Schools.  In fact, searching ‘plastic surgery infographic’ yields 283,000 results on Google. Create and post infographics on your site to take advantage of this pool of interested users.

    The average page visit lasts under a minute, but an infographic can keep a user reading for longer. In fact, a Search Influence-produced infographic detailing the legendary New Orleans Mardi Gras renewed interest among people that visited the official New Orleans tourism guide website. While visitors to the website typically spend an average of two minutes browsing, visitors to the Mardi Gras infographic page were spending upwards of eight minutes.

    Infographic Content Marketing Image Search Influence

    Ninety percent of the information processed by our brains is visual, so it’s only logical that we are more drawn to vibrant images than walls of text. Readers are likely to skim the infographic, absorb the information, and then explore the site further to learn what else you have to offer.

    Be sure to add some written content outside the graphic. Site crawlers cannot scan images, so your optimized content must also appear elsewhere on the page in order to attract search engine hits.

    To keep your users on your website, it is vital that your infographic loads quickly! The average user expects a page to load in under three seconds and will not hesitate to close a window that does not deliver fast enough. The quicker your site loads, the better your conversion rates will be.

    Infographics Boost Social Media Reach

    Your plastic surgery clinic can also use infographics to attract more social media followers and shares. That’s because images perform well on Twitter—even better than videos! For example, images get 128 percent more retweets than video tweets, according to Quicksprout. Similar to web pages, our eyes are instinctively drawn to tweets with alluring images.

    To properly post your infographic on social media, however, you have to make sure it is shareable and easily traced back to your site. Use an embed code in the infographic so other industry professionals can easily add it to their sites. On the graphic, place your website address and the name of your clinic in bold letters. If your link or commentary is deleted through sharing, your clinic name will still remain. Using easy share links such as ow.ly or bit.ly can also make it easier to share on Twitter, Facebook, and Pinterest.

  • How A Little Nip And Tuck Can Improve Your SEO

    Makeovers aren’t just for mommies looking to restore and improve their post-pregnancy appearance through multiple, personalized plastic surgery procedures. Makeovers can also work wonders for websites in the cosmetic medicine industry. If your website isn’t bringing you a consistent stream of new patients, it may be time to give your site a much-needed SEO facelift. Learn how adding graphics to your website can help you get results!

    DoctorImage
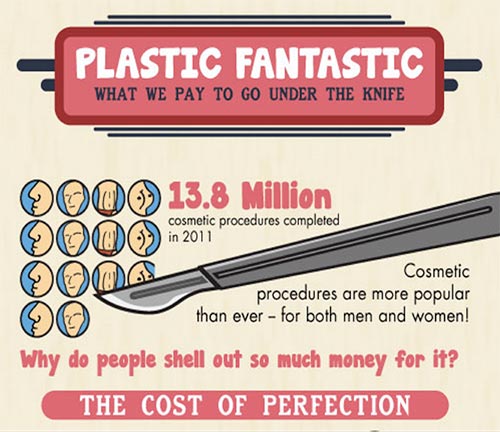
Quick—what do professional skin care, breast augmentations, and braces all have in common?

    Give up? Well, first of all, if you want any of these things, you’ll need to seek the help of an accredited medical professional—a dermatologist, cosmetic surgeon, or orthodontist, respectively. More importantly, however (at least for the sake of this blog post), is the fact that you can actually see the end results of these types of medicine. So how can medical professionals incorporate these visible results into their SEO strategy?

    If your medical specialty provides some sort of aesthetic benefit, there is a good chance you could (and should) be doing more to improve your rankings in organic search results. “More” in this context doesn’t mean “more keyword-rich text” or “more high-quality links to your site.” Instead, it means taking advantage of industry-specific SEO opportunities. Optimizing and adding images, educational infographics, or patient testimonial videos can have a significant impact on your site’s search visibility.

    Optimize Existing Images

    Optimizing image file names, alt text, and title text will give search engines information about the image and the content on your site. Any images can be optimized with keywords, but before and after images of your patients are an excellent industry-specific opportunity to naturally incorporate relevant keywords into your site’s content.

    One of our clients, a plastic surgeon, has a before and after image gallery on his site. We optimized each of the images in the gallery and saw some interesting results. Links to the gallery outperform the corresponding page on his site for the majority of his targeted keywords. The same client even has images that rank in organic search results!

    NoseJobSearchImageResults

    Add Relevant Images

    It’s important to note that Google can’t read or understand images without alt text or title text. But a page with relevant images that have no alt text or title text will most likely still rank better than a page without images! Why? The answer is simple—the ranking algorithm also pays attention to user behavior. If your site’s visitors are happy with what they see, search engines will recognize a pattern and reward your website for providing quality content.

    Another one of our clients, a plastic surgeon in New York, didn’t have a before and after image on his BOTOX® page. As an authorized physician, our client was allowed to use some images provided by Allergan, the manufacturer of BOTOX® Cosmetic. We chose this relevant image and placed it on his site:

    BotoxBeforeAndAfterImage

    In the 30 days after we implemented this image, the average visitor spent 13% more time on the page compared to the previous 30 days. When visitors landed on the page from organic search, the bounce rate improved by 24%. Both of these stats demonstrate to Google that users are not only finding the information that they’re looking for on this page, but that it’s also engaging enough to keep them on the site.

    Create Custom Graphics

    Another behavioral signal that has become increasingly more important is social behavior. Adding custom graphics to your site is a great way to promote social media sharing and demonstrate positive social signals to search engines. And, like other images, custom graphics also give you the opportunity to create keyword-rich file names, alt text, and title text.

    PlasticFantasticInfographicImage

    The infographic above was shared more than 2,000 times on Facebook. The month it was published, the site saw a 25% increase in referral traffic compared to the previous year. It’s relevant, informative, and interesting for viewers. In other words, it’s exactly the kind of content that helps with SEO.

    Upload Testimonial Videos

    There are other options if you don’t want to use before and after images or infographics. Another one of our clients in the field of plastic surgery uploads patient testimonial videos to his site. Generating nearly 9,000 page views in 2014, these testimonials have certainly had a positive impact on his site’s search rankings. The fact that these patients were so happy with their results has also helped to bring in new business.

    TestimonialVideoGalleryImage

    *Note the keywords in the video titles.

    Get Results

    In the end, people considering a cosmetic procedure want to know that they’ll be satisfied with the results. Search engines want to see that your site is providing quality results for the people who are searching. Using images, graphics, and videos can help kill both of these birds with one stone. You’ll be rewarded with better organic rankings, website traffic — and, ultimately, more business.

  • Five for Friday: Is Your Social Media In Good Hands? Link-Dieting & More

    1. New Year, New Link Takedown – Search Engine Land

    As we all know, many sites were put on Google’s naughty list thanks to Penguin’s distaste for bad links. Their next move? Request, request, request. Looking back on 2014, Google certainly got a lot of action. Torrent Freak reports that Google received a 75% increase in link removal requests in 2014 as compared to the previous year. We’re talking highs of 12 million URLs requested for removal per week. 2014 was clearly the year of cleanup.

    2. Project Share Aware: Sugar Bowl Not So Sweet For Some – MarketingLand

    An unsuspecting real-life couple, dubbed “oversharers” by Allstate, was burglarized during their outing to the Sugar Bowl. You might be wondering why an insurance company would do such a thing. Allstate’s latest campaign, Project Share Aware, aimed to alert the public to encroaching social media-savvy burglars. Long story short, if you’re telling people where you are in a public sphere, those without your best interest in mind (aka burglars) can take advantage of your oversharing. The event went as far as holding a fake online sale of the couple’s property using #MayhemSale on Twitter. Many claim this was just another ploy of Allstate’s fear-mongering advertising tactics, but it certainly made a few rethink their privacy settings. Although rattled, the couple did walk away a little sweeter with free Sugar Bowl tickets.

    MayhemImage

    3. Modern Family: Device Edition – Search Engine Land

    This may not come as a surprise, but if it’s not on a modern advertiser’s to-do list, it certainly needs to be. What am I referring to? Cross-device advertising. We’re talking about your new modern family, each member gazing at their device of the moment, whether it’s a PC, mobile, or tablet. John Crosley, Bing Columnist, argues that households engaging with multiple devices within one day tend to be more receptive to advertising. The overall goal? Reaching your audience, wherever they are and on whatever device they may be using at the moment. Let’s just say cross-device advertising is the Lily of Modern Family.

    ModernFamilyLionKingImage

    4. New Year’s Resolutions: Cutting Carbs or Social Media? – Community2Business

    Which did you pick? If you picked social media, you’re probably in the right place. As you step into 2015, take some time to rethink how you’re reaching your audience. Some top tips include boosting visuals, knowing when the time is right, and monitoring your #HASHTAG.

    First things first, if your post lacks engaging visual content such as images, memes, or infographics, your audience will likely yawn and pass through. Also, consider donning those visual-friendly social media platforms like Pinterest or Instagram. Tick, tock – we’re talking about time. Although articles regarding the perfect posting times abound, don’t forget you’re unique! Pay mind to your particular market or industry and play around with tools to measure what time is actually best for you to post. Finally, it’s time to discuss the beloved hashtag. While this is an incredibly relevant and useful tool, it can be abused. Make sure you are picking appropriate wording and wisely follow the rule of no more than three hashtags per post!

    MeanGirlsButterImage

    5. Boost Your Newsworthy-ness! – Business2Community

    Based on an analysis of 2014 search trends, the most searched items were Robin Williams-related. This was followed up by the World Cup, ISIS, Frozen, and more. What can we take away from this? People want news! Alongside your SEO efforts, focus on making your business reflect the most recent, exciting news in the industry. As an added bonus, if you regularly update this information, it will be new news. And as we all know, Google loves to bask in fresh, updated content. Now, that’s killing two birds with one stone!

    Image Sources:

    Mayhem Last Item 4 Sale Tweet

    Modern Family Gif

    Mean Girls Gif

  • Google+ Crush Saga: Your Guide To Social Media Sweetness

    Google+ is SO complicated! That’s what a lot of our clients tell us. They get frustrated and, to be honest, so do we.
    There are so many questions! It can be overwhelming.

    What kind of Google+ page should you create?

    Which Google+ page should you use for posts and updates? Which page should you connect to your YouTube channel? How many types of Google+ pages are there?

    To simplify this Google/YouTube situation, we’ve created this sweet little infographic to show:

    • Which pages you should create
    • Which page(s) you should use for regular posts and updates
    • Which page you should connect to YouTube

    As a reminder, there are three types of Google+ Pages:

    • Google+ Profile
    • Google+ Local/Social Page
    • Google+ Brand Page

    Explore the sweet and colorful world of Google+ Crush.

    Mix and match pages to form the correct combination, create the appropriate profile, and send the right social signals. First, choose how you’d like to play the game by selecting one of the paths.

    GooglePlusCrushInfographicImage

    If Google+ Crush Isn’t Your Type of Game, Just Read the Manual:

    • Are you looking to use your G+ profile for personal reasons (not associated with a business)? Start posting on your Profile Page and connect this page to your YouTube Channel.
    • Are you a business with just one location? Start posting on your Local/Social Page and connect this page to your YouTube Channel.
    • Are you a multiple location business? Create a Local/Social Page for each location. You should post to your Brand Page and connect your Brand Page to your YouTube Channel.

    Sugar crush! Remember, Google likes it when you play in their sandbox, so go ahead and start posting on Google+ and use YouTube channel to create your unique videos.

    And, above all, crush it!


  • SEO vs. PPC: What’s The Difference Anyway?

    A while back, SEO guru David McBee wrote a post in his awesome blog about how he differentiates SEO tactics from PPC strategies. In David’s mind, it can all be related to the difference between dieting and plastic surgery. SEO is a diet, and PPC is plastic surgery.

    To illustrate his point, David created this awesome infographic which I think spells things out pretty well. In many ways, this categorization really gets to the root of the differences between what you would do to increase your site’s profile online using SEO tactics versus the much more immediate PPC strategies we all employ.

    The SEO Diet

    It is very true that SEO is like a diet for your online presence. You need to be in it for the long haul, and you really need to establish clearly defined goals before you start. In exactly the same way that a crash diet will not yield the long term results you are looking for, link baiting or deploying tons of spammy content will not help you reach your idea SEO weight.

    I really like the comparison of PPC to plastic surgery because I feel like you should be putting the same kind of thought to the planning stages of a PPC campaign that you would before a procedure like a face lift or tummy tuck.

    The PPC Procedure

    You need to figure out exactly what you want to focus on and a lot of thought has to go into what you want to look like on the other side. Nothing is worse than not being prepared for an onslaught of traffic hitting your site on the heels of a successful PPC campaign.

    What do you think of David McBee’s comparison? What would you say the SEO/PPC dichotomy resembles in your experience? Let us know in the comments! We would love to hear from you, even if you are on a juice cleanse SEO diet.

    Link for infographic: http://davidmcbee.com/seo-is-a-diet-ppc-is-plastic-surgery-infographic/

  • Make Your Infographics Count

    Infographics have been around for years. We have seen them in cave paintings and hieroglyphics. William Playfair was credited with the first area chart and pie chart in his 1790 book, The Commercial and Political Atlas. Over the years, we have pushed forward the design of learning concepts with the aid of images. This work has lead us to what we refer today as infographics.

    If you haven’t been on Pinterest or read any major newspaper, you may be unfamiliar with the concept. An infographic is the process of using visual data to represent a complex idea in an easier to digest medium for the masses. You can’t get your PhD through an infographic, but they are handy at teaching you a quick synopsis of a subject.

    The strength in infographics is found by following a few basic concepts:

    Bring Multiple Ideas Together

    The magic of an infographic is its ability to take a wide amount of information and consolidate it into a story that flows and ebbs. The beauty is in the point where all these ideas join to create a new message or way of looking at all those ideas together.

    Be Understandable

    When presenting new ideas and concepts, it is important that the viewer understands what the message is. Try not to get the viewer confused or use terminology that is way above their knowledge based. It is good to use this jargon, but remember to explain it in a way that your 80-year old grand pap may comprehend.

    Less is More

    When designing or writing for an infographic, it is important to remember not to bombard the viewer with copious amounts of data and figures. The idea is to keep the content flowing in a smooth way that is easy to understand and recall. Designers do this by narrowing the focus of an infographic into one main concept or story to gently guide the viewer into learning the message.

    Be Welcoming

    It is important to never be intimidating when designing an infographic. The message should never appear overbearing or intimidating. The overall goal of infographics is to be read and spread.

    Eye Catching

    The overall design of the infographic needs to be alluring for the viewer to want to read it. There is no sense in spending all that time researching, writing, and designing only to have viewers not be interested in what you have to say. It is important to make sure there is a visual hook that will pique the interest of any viewer.

    All images in this post of the original work of Search Influence. Please give attribution if you should decide to share.