Tag: analytics

  • Turn Data Into Decisions With Your 2025 KPI Dashboard

    Turn Data Into Decisions With Your 2025 KPI Dashboard blog by Search Influence

    Key Insights

    • KPI dashboards consolidate key performance metrics into a single, visually intuitive platform, providing clarity and actionable insights.
    • Aligning KPIs across marketing, sales, and leadership ensures all teams work toward shared strategic goals. A centralized dashboard eliminates data silos, fosters collaboration, and enhances decision-making.
    • KPI dashboards empower marketers to make budget-conscious, data-backed decisions, whether tracking costs like CPI and ROI or monitoring performance across multiple data sources,

    A KPI dashboard is a tool that visualizes your key performance indicators (KPIs) and consolidates these critical metrics in an easily digestible format, typically through charts and graphs. Modern KPI dashboards allow you to quickly analyze your performance and uncover actionable insights to optimize your campaign while bypassing the headaches of data overload.

    Imagine a NASCAR driver pushing the pedal to the metal without a dashboard above his wheel to help guide his decision-making. That’s pretty risky.

    Not using a KPI dashboard to drive marketing decisions in your online ad campaigns is similarly dangerous.

    In this blog, we’ll explain how to use your KPI dashboard software to maintain data accuracy, track progress, and boost marketing performance in 2025 and beyond.

    Buckle up — you’re on the fast track to valuable insights.

    The Top 5 Things You Should Use Your KPI Dashboard For

    1. Visualize your funnel and identify fallout points

    A well-designed KPI dashboard brings clarity to complex data, enabling marketers to pinpoint fallout points at each stage of the funnel. By analyzing historical data and tracking key metrics such as lead-to-MQL and MQL-to-SQL conversion rates, you will quickly find areas where your funnel doesn’t perform as expected.

    Benefit: Pinpoint friction points to improve conversions

    When you visualize key performance indicators, you’re not just looking at raw numbers — you’re gaining actionable insights. By identifying where prospects are dropping out, you can adjust messaging, optimize touchpoints, and create a smoother journey for your audience.

    Case study: Higher education KPI dashboard example

    Charts from a KPI dashboard created by Search Influence

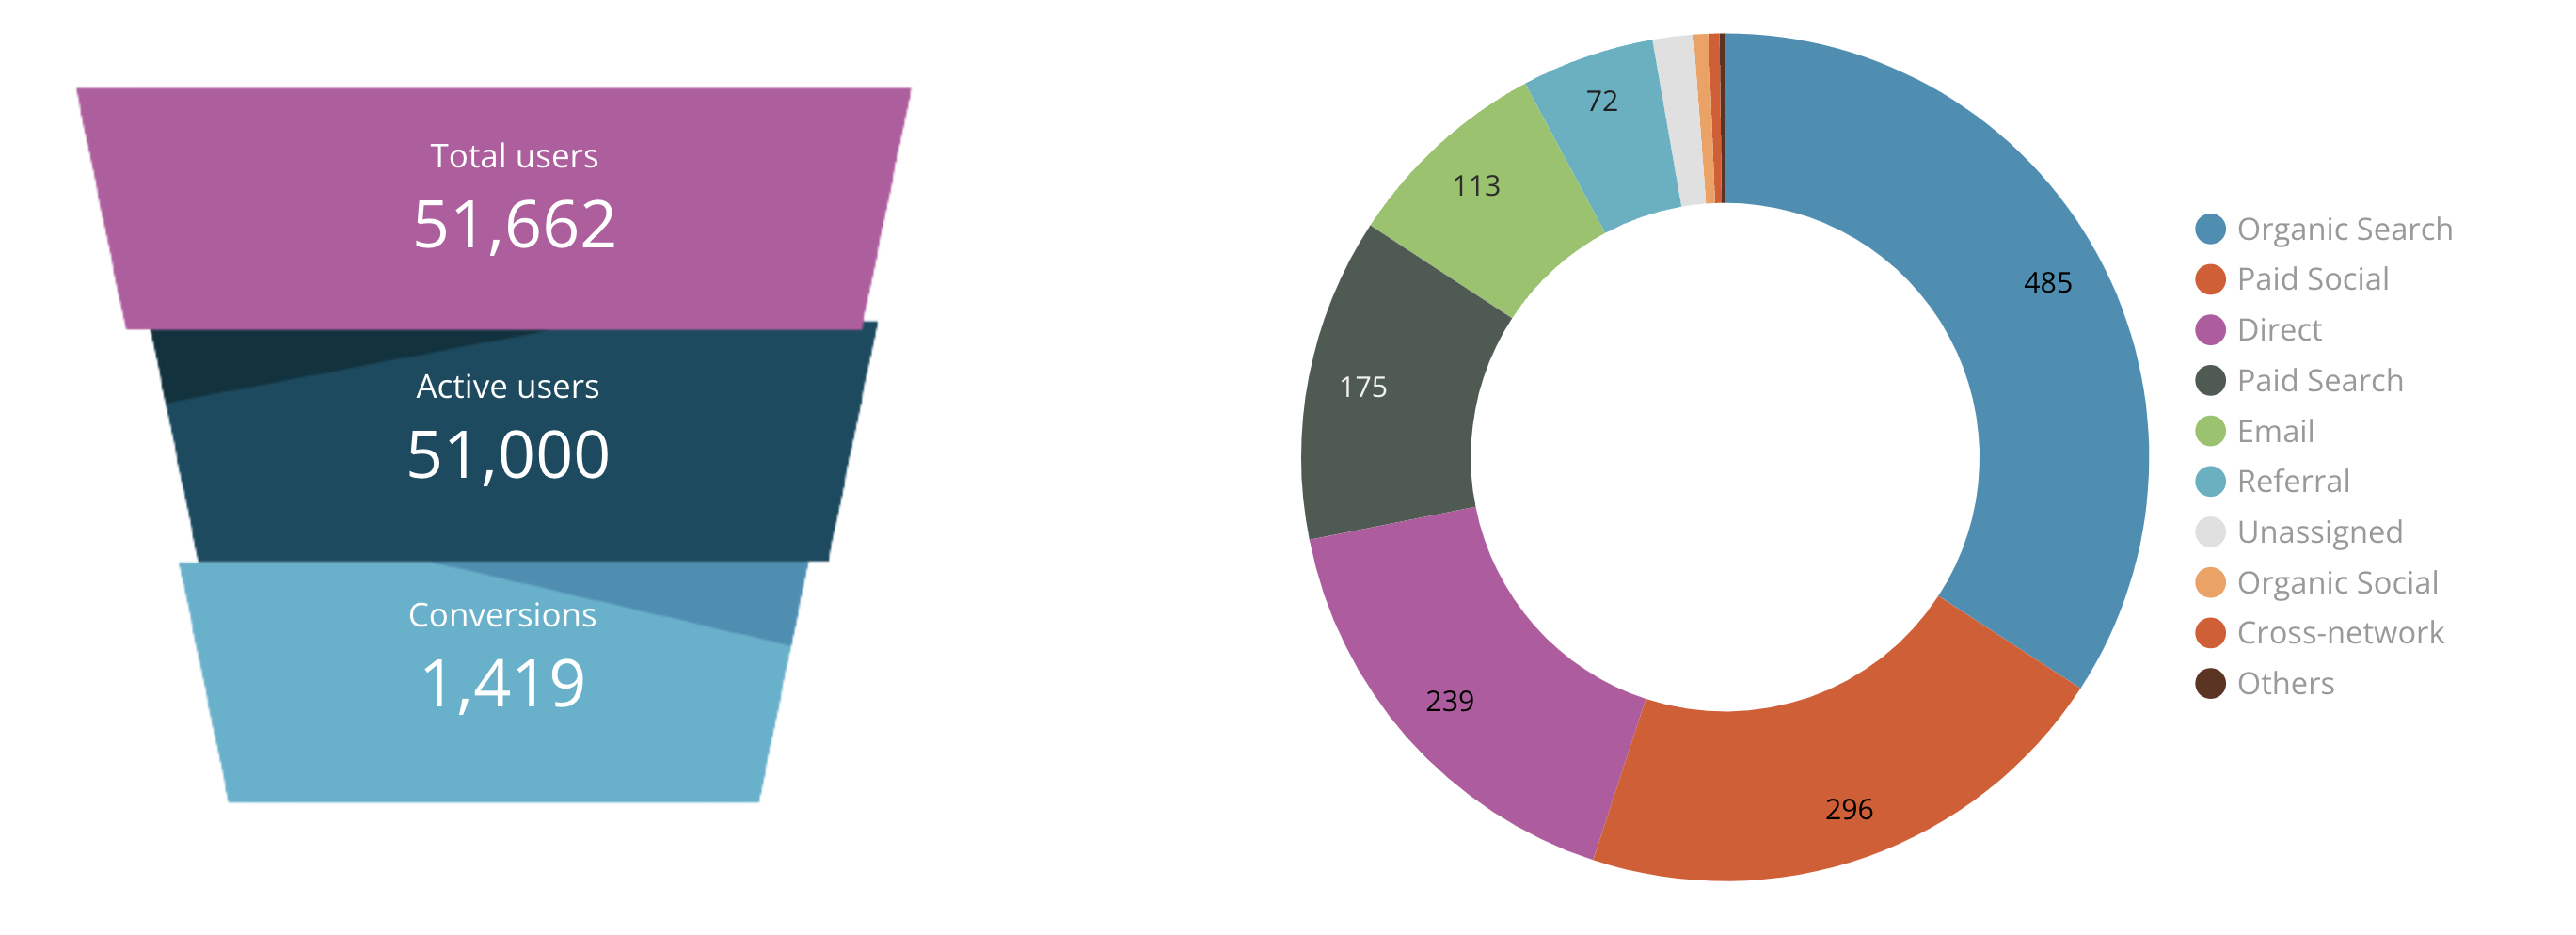
    Search Influence collaborated with one of our long-time higher education clients to create a KPI dashboard that simplified their data and visualized their campaign outcomes. 

    This private research university’s marketing objective was to continuously grow incoming inquiries and start applications for their priority degrees and programs through digital advertising, SEO, email marketing, and PR.

    Our KPI dashboard enabled the higher education institution to pinpoint successful areas of their campaign and allocate more resources to them.

    Keyword performance charts from a KPI dashboard made by Search Influence

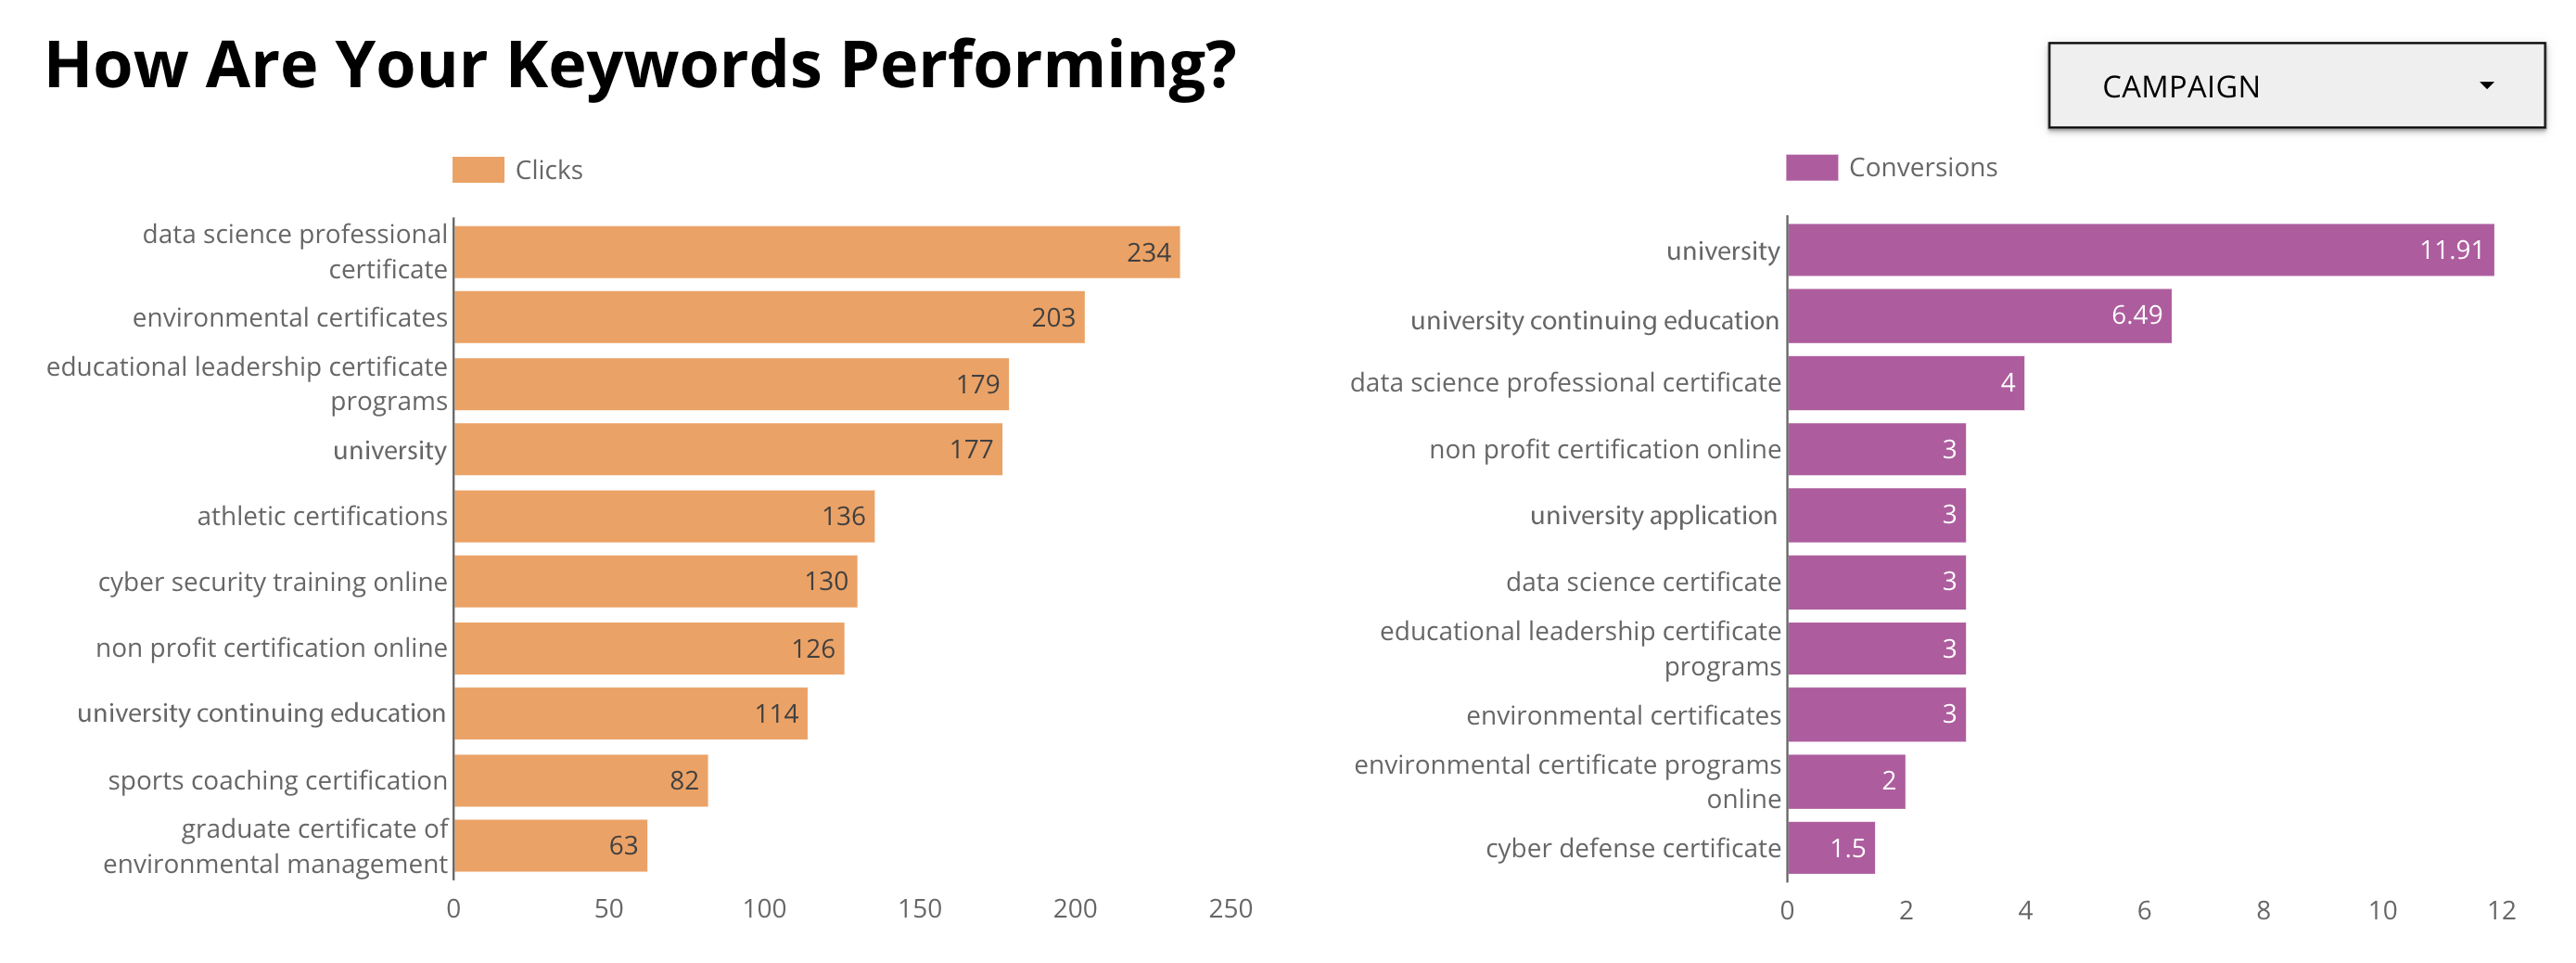
    Equipped with access to clear data points, our higher education client adjusted their paid and organic search campaigns to include the high-performance keywords driving clicks and conversions. 

    This attention to detail led to nearly 140,000 impressions in November and December of 2024 alone. 

    2. Assess lead quality to improve ROI

    Not all leads are created equal, and understanding lead quality is essential for maximizing the return on investment (ROI) of your digital advertising campaign.

    With an executive KPI dashboard, marketers analyze lead quality in real-time using data visualizations that highlight key insights. 

    By evaluating key performance indicators like cost per lead (CPL), cost per acquisition (CPA), and cost per inquiry (CPI), you can align your efforts with your strategic goals.

    Benefit: Focus on high-quality leads for better ROI

    Focusing on high-quality leads ensures your campaigns are both effective and efficient. For instance, tracking engagement indicators such as email open rates, website visits, or time spent on landing pages within an analytical dashboard helps identify leads most likely to convert. Prioritizing these leads allows you to allocate resources more strategically and see a measurable improvement in ROI.

    3. Align on KPIs that truly matter

    Many marketers struggle with overwhelming amounts of data, making it difficult to focus on what truly drives success. An operational KPI dashboard empowers you to zero in on the relevant data that aligns with your marketing goals.

    Graphic of what it takes to make a unified KPI Dashboard by Search Influence

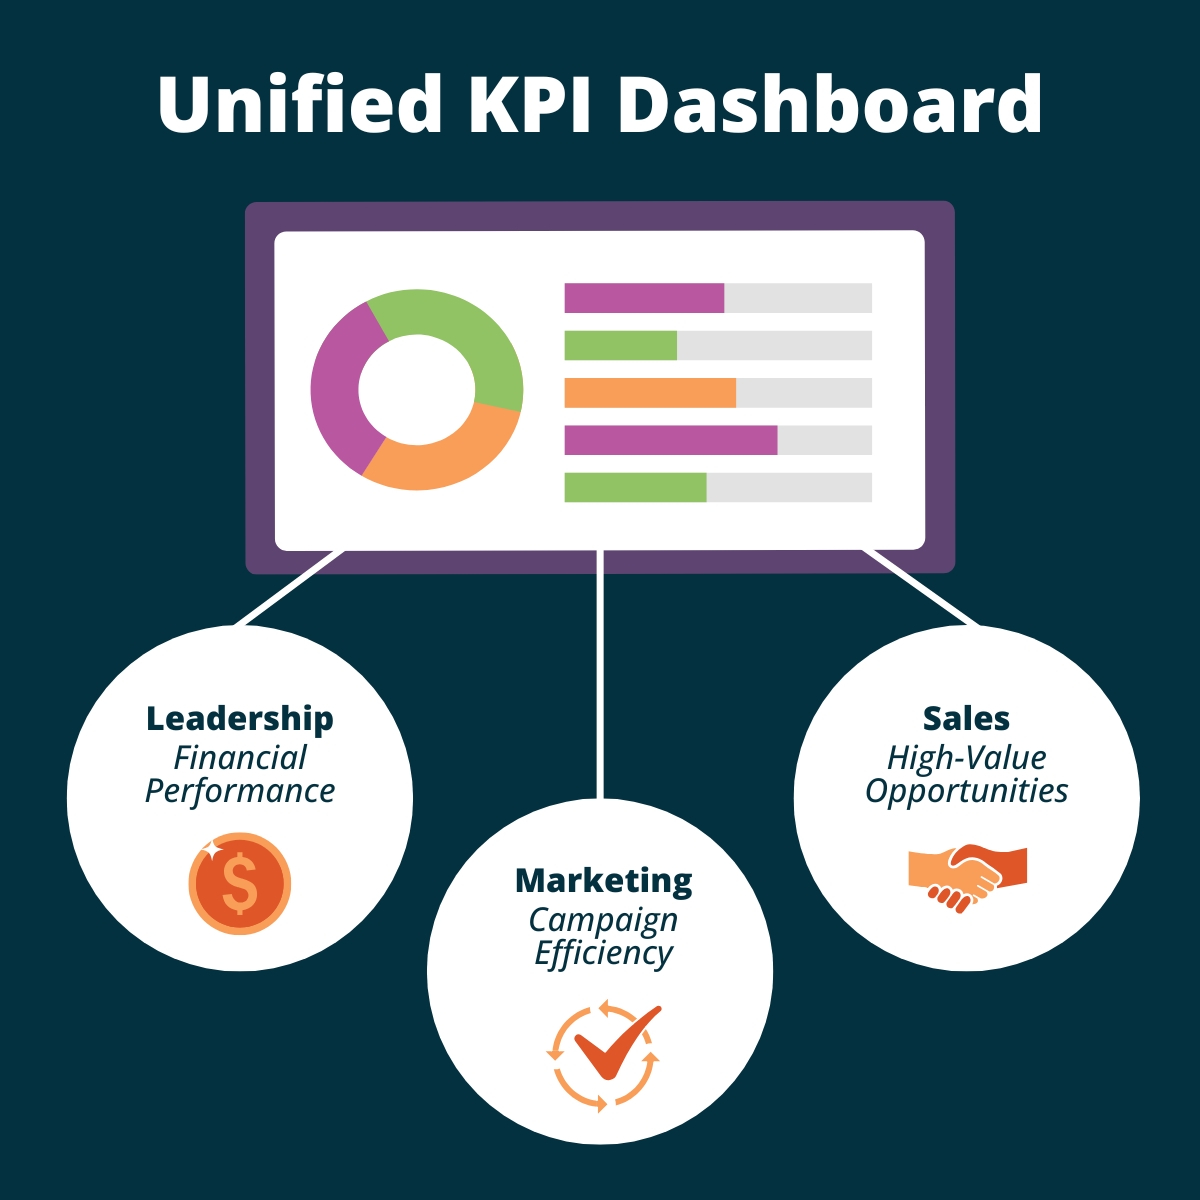
    Coordinating key performance indicators across marketing, sales, and leadership teams ensures everyone works toward the same objectives. For example, marketing might track customer acquisition cost (CAC), while the sales team monitors conversion rates. Combining these metrics into a unified KPI report provides a clear picture of performance across departments.

    Benefit: Enhanced collaboration and better decisions

    When all teams work from the same operational KPI dashboard, it creates alignment that fosters trust and transparency. Leadership can focus on financial performance, sales can prioritize high-value opportunities, and marketing can track campaign efficiency — all while working toward shared strategic goals.

    4. Get a clear picture from multiple data sources

    Modern marketers rely on an array of tools — Google Analytics, CRMs, social platforms, and more — to collect valuable data. The challenge lies in making sense of these fragmented insights. A marketing KPI dashboard solves this problem by consolidating data from multiple sources into one unified view, creating a reliable single source of truth.

    When raw data is combined into a centralized operational dashboard, it transforms into actionable insights. The dashboards’ visual nature gives stakeholders clear insights on how to optimize their campaigns.  

    By aligning important performance indicators across platforms, business leaders will eliminate silos and ensure all teams are working from the same playbook.

    Benefit: Save time and make unified decisions

    Consolidating data into a single dashboard saves countless hours of toggling between platforms. It also promotes collaboration by breaking down departmental barriers. With interactive charts and real-time data, decision-makers can easily visualize operational metrics and overall performance.

    5. Track critical costs and performance indicators (CPI, ROI, and more)

    Budget-conscious decision-making is only possible when you have a clear view of your spending. The right KPI dashboard software makes data analysis straightforward, enabling you to identify where your marketing dollars are used most effectively.

    Benefit: Optimize spend and eliminate inefficiencies

    Tracking cost-related metrics ensures your campaigns are efficient and impactful. By using your dashboard to analyze data, you will quickly spot underperforming initiatives and reallocate funds to strategies that yield better results.

    KPI Dashboard FAQs

    How do I create a KPI dashboard?

    To create a KPI dashboard, start by identifying the best KPIs for your campaign and marketing goals. Use tools like Google Data Studio, Tableau, or custom software to visualize these metrics. Many of these platforms include template galleries you can tailor to fit your needs and help you get started. You can centralize your insights into a single, cohesive view by integrating data sources such as Google Analytics, CRM tools, and social platforms. 

    How do you use a KPI dashboard effectively?

    To use a KPI dashboard effectively, it’s important to regularly refer to it for actionable insights. This allows you to monitor team progress, track past performance, and adjust strategies as needed. 

    But without the proper team in place to monitor your dashboard, even this clear, visual aid turns into a sea of confusion.

    Hiring an experienced digital marketing agency like Search Influence is like throwing your team a life preserver. 

    Search Influence ensures you fully leverage your dashboard by using analytics and lead tracking to inform your strategic planning and optimize your efforts. Whether you have questions about results or need to pivot your campaign to new goals, we simplify the process.

    What data should be in a KPI dashboard? 

    A well-designed KPI dashboard should include key indicators tailored to your goals. For marketing, this might involve metrics like cost per impression (CPI), return on investment (ROI), and conversion rates. Sales managers may focus on lead-to-close ratios or revenue growth. The best dashboards also include metrics for monitoring performance, like customer acquisition costs, traffic sources, and campaign engagement, ensuring that all critical data is visible at a glance.

    What are the best practices for KPI dashboard design?

    • Simplicity: Focus on the most relevant performance metrics to avoid overwhelming users.
    • Clarity: Use intuitive charts and visuals to ensure the data displayed is easy to interpret.
    • Customization: Tailor your dashboard to align with specific marketing objectives.
    • Real-time updates: Ensure data is updated regularly to support data-driven decision-making.
    • Accessibility: Design for all stakeholders, so everyone benefits from the insights.

    What are the three essential elements of a KPI dashboard?

    • Data consolidation: Integrate information from multiple sources to create a unified view.
    • Real-time tracking: Include up-to-date metrics to ensure accurate performance monitoring and informed decisions.
    • Actionable insights: Focus on metrics that drive strategic planning and empower your team to make data-driven decisions.

    Turn Data Into Decisions With Help From Search Influence

    KPI dashboards are indispensable for marketers and business leaders aiming to stay ahead in 2025. They help you visualize your funnel, assess lead quality, align team goals, consolidate multiple data sources, and track critical costs.

    Search Influence has the expertise to create and analyze custom dashboards that align with your marketing objectives. We help you focus on the metrics that matter, enabling you to optimize your strategies and achieve better results.

    Take the guesswork out of your data.

    Contact Search Influence to see how we will help you harness the power of KPI dashboards and elevate your business with our digital marketing services.

  • No. Don’t “Upgrade” to Google Analytics 4 (GA4). Instead, install it and run it in Parallel.

    Don’t “Upgrade” To Google Analytics 4 (GA4) Just Yet

    Google has been urging Analytics users  – mostly by email – to “Upgrade” to Google Analytics 4 (GA4).

    At Search Influence, we are installing GA4 but not “upgrading” just yet.

    No doubt, GA4 will be a great improvement, but there are a few really compelling reasons not to go all in just yet.

    A while back, David, our senior web developer, wrote a pretty comprehensive blog post about switching to Google Analytics 4, which you should check out. Below, I’ll reiterate a couple of his points, plus a few more.

    Google Analytics 4 user interface - Should you upgrade to GA4?

    Google Analytics And The Cookie-less Future

    In short, a big reason for this change is to accommodate a cookie-less world. As users can now opt out of tracking, it may be more difficult to gather user experience data if cookies are the way you get that done.

    Google Analytics 4 is not yet a fully baked product. Google tends to take an agile development approach and test new products and features with users.

    Even though it is Cookie-based, Universal Analytics – the current version – is a stable product.

    Do You Even Track Metrics, Bro?

    Google Analytics is great, but there are things it doesn’t do well. Some of the tools that you use to supplement Google Analytics may be negatively impacted if you make the switch too early.

    Some examples:

    In short, just because the Google Analytics team is ready for you to switch doesn’t mean everybody else is. Third parties and even some Google Properties development teams have to catch up to the GA4 APIs and interface changes.

    Third-party tool providers need a chance to get caught up with the new Google Analytics.

    Search Influence And GA4 For Clients

    Google plans to deprecate Universal Analytics as of July 1, 2023.

    In the next few weeks, we will be installing the GA4 tracking code on our client sites (again, alongside Universal Analytics) or recommending their developers do if we don’t have access.

    This way, we will have a full year’s worth of data when Universal Analytics sunsets.

    We’re not making a wholesale switch right now for the reasons above, but we feel it’s important to start collecting data in the new tool to enable good historical reporting in future years.

    We use CallRail and Google Data Studio for most of our client reporting and some internal dashboards, too. We are not willing to risk the integrity of that data for decision-making and reporting to move the newest, coolest Google toy.

    Again, David’s post goes into much more detail about switching to GA4, but I hope this gives a high-level view of the Search Influence approach to integrating this new platform.

    And, of course, if you need help setting up Analytics, Tracking, and Reporting for your organization, please get in touch. We’d love to help.

  • 2020 Medical Search Trends: Medical Searches Met and Exceeded Pre-COVID Levels Across Specialities

    2020 Medical Search Trends: Medical Searches Met and Exceeded Pre-COVID Levels Across Specialities

    This post was updated by Paula French on March 4, 2021 to reflect refreshed statistics and analysis. It was originally published in October 2020. 

    Key Insights:

    • Monitoring search trends can make your campaigns more effective because you can adjust your strategy based on the latest information.
    • As of January 2021, several medical practice areas, including cardiology, neurology, urology, and gynecology, have seen their search volumes return to pre-COVID levels.
    • Cosmetic procedures saw a short-lived dip in search interest for liposuction, rhinoplasty, breast augmentation, and face lifts in March. By the end of May 2020, interest exceeded pre-COVID levels for 3 of the 4 procedures: liposuction, rhinoplasty, and breast augmentation. Face lift interest exceeded pre-COVID levels in late July.
    • Addiction treatment searches didn’t drastically dip as much as other medical specialties and have been slowly rising to their pre-COVID levels. The most recent data indicates they have now exceeded early 2020 interest.

    2020 Medical Search Trends

    Monitoring search trends is a critical piece of managing a productive digital marketing strategy. It can inform your need to adapt your marketing strategy, whether that is away from search to other mediums or to invest more heavily in search engine optimization and paid search.

    2020 has seen shifts in search trends unlike anything I’ve seen in my 11 years working in SEO. It’s no surprise given the “pivots” and “unprecedented” year we’ve had. In a recent conversation with a colleague in the medical industry, we discussed expectations for 2020 healthcare revenue and what we’ve seen so far in the return of patient confidence.

    I was interested to see how search trends on Google mapped with what we had seen with the practices and hospitals with which we work, so I took a look across several practice areas and assessed the data.

    How do I read the Google Trends charts below?

    Each chart that shows the change in the amount of interest in a given topic based on the number searches during a time frame. Specifically, Google calls this metric “Interest over time” and defines it as “search interest relative to the highest point on the chart for the given region and time. A value of 100 is the peak popularity for the term. A value of 50 means that the term is half as popular. A score of 0 means there was not enough data for this term.”

    For more on how Google calculates Trends, see here: FAQ about Google Trends.

    I have included a table of my own analysis of the numerical data, looking for highs, lows, and averages both “pre-COVID” and “post-COVID.”

    In some analyses below, we look at “Topics” which looks across several ways people could be searching to gauge searchers interest level at a point in time. In others, we look at “Search terms” which is used when it makes sense to compare to similar search terms that would otherwise fall under the same topic (such as “drug rehab” & “alcohol rehab,” as they both fall under the topic of “addiction treatment”).

    Medical Specialities: Cardiology, Neurology, Urology, Gynecology, Oncology

    Summary of findings for medical speciality search trends:

    • By October 2020, searches were either at or right below pre-COVID levels, and saw a similar peak in January 2021.
    • Cardiology, neurology, urology, and gynecology all follow the same pattern: initially, searches for these specialties dipped in March 2020, but people were still searching for these terms, even in the earliest days of the shutdowns.
    • The lowest point of searches for these topics was around mid-April, which is when the public started to recognize that this stay-at-home life was going to become our new normal for much longer than we originally thought.
    • Since April 2020, searches have been on the rise, with dips during the holiday weeks of July 4, Labor Day, Thanksgiving, and Christmas.
    • Oncology saw a lower level of variation throughout the year. Interest levels dipped slightly after the shutdown and remained steady afterward, with an interest level ranging from 21-38, averaging around 30.

    2020 Google Trends for Medical Specialties

    Cosmetic Procedures: Liposuction, Breast Augmentation, Rhinoplasty, Rhytidectomy (Facelift)

    2020 cosmetic surgery trends chart

    Summary of findings for cosmetic procedure search trends:

    • There was an initial, short-lived dip in search interest for liposuction, rhinoplasty, breast augmentation, and face lifts (rhytidectomy). This dip spanned across the end of March and into April.
    • After the dip, there was a surge in interest, with the number of searches actually exceeding pre-COVID levels at the end of January 2021 for liposuction, rhinoplasty, breast augmentation, and face lifts.
      After the dip, there was a surge in interest, with the number of searches actually exceeding pre-COVID levels at the end of January 2021 for liposuction, rhinoplasty, breast augmentation, and face lifts.
    • By late January 2021, liposuction saw peak interest (100), significantly exceeding pre-COVID interest levels, when the peak was 79.
      Rhinoplasty interest also peaked in July and remains above the pre-COVID average.
    • Breast augmentation search interest met and then exceeded pre-COVID interest in the summer of 2020, and has peaked above the pre-COVID high in January 2021.
    • Face lift interest initially peaked in July at 36, decreased a bit through the fall, and peaked again in January 2021, with an interest level of 33, which is higher than the pre-COVID peak of 31.

    2020 Google Trends for Cosmetic Surgery industry

    Addiction Treatment: Drug rehab, Addiction treatment, Alcohol rehab

    2020 addiction treatment google trends chart

    The addiction treatment search interest analysis is based on specific “search term” interest, whereas medical and cosmetic graphs above were based on topic interest. This is a result of the availability of data for topics vs. search terms.

    Summary of findings for addiction treatment search trends:

    • There was also a significant dip in addiction treatment search terms, but interest has risen to varying degrees in comparison to pre-COVID peaks.
      The search term “Drug rehab” saw it post-COVID peak interest (89) in the week of August 16, which is only slightly less than the pre-COVID high on February 16 (100).
    • The pre-COVID 2020 average for “addiction treatment” was 60. During the heaviest shutdown period (March 15–May 10), the average interest was 44, with the lowest point being 26 on March 15. The post-COVID peak was September 27, with an interest level close to pre-COVID levels (58).
    • “Alcohol rehab” searches reached their peak (58) during the week of December 27, exceeding the pre-COVID 2020 high of 52 in late January.

    Addiction treatment data chart

    How can search trends help us help more patients?

    I assume that by now you’ve compared this data to what you see at your practice or hospital. The goal of monitoring search trends (along with your own campaign-level data) is to inform necessary adjustments to your medical marketing strategy.

    During the early months of shutdowns, we were hyper-focused on looking for shifts in consumer behavior to adjust our strategies. In the best-case scenarios, we were able to shift budget to the channels where our clients’ audiences were spending their time and away from the channels where they weren’t as active (and produced some really awesome results). Then, we made additional changes when that activity returned.

    There are several reasons we can attribute to the overall return of searches and why in many cases, medical searches are exceeding their pre-COVID levels. Whatever the reasons, this is a critical time for businesses to analyze their marketing mix closely to assure they are both

    • carefully spending their marketing budget
    • confident they’ll understand the outcomes of their marketing investment

    If you’d like some support in analyzing where you’re currently investing in marketing, want some fresh ideas, or are interested in partnering with an agency like ours, reach out. Our dedicated team of strategists will work with you to understand your goals for 2021 and provide recommendations to help you build your patient pipeline.

    P.S. If you are looking for more insights, check out our recent post “How Hospitals and Healthcare Practices Can Adapt to Google Updates” and follow along with us on our Healthcare & Medical Marketing Blog for future industry updates.

  • Manage Tags Like a Sys Admin: 5 Ways Google Tag Manager Will Change Your Life

    1603-SI-Newsletter-0331-KG-D-02

    Where would we be without Google? It seems like for every issue that comes up in the field of online marketing, Google is ready with a solution. Google Tag Manager is one such solution. But before we examine the benefits of using this savvy tool, let’s first clarify what a tag is.

    What Is a Tag?

    Simply put, a tag is a snippet of website code that tracks visitors on a website. It allows companies to collect data for affiliate marketing, retargeting, conversion tracking, personalization, and a plethora of other cool marketing techniques.

    What Is Google Tag Manager?

    Back in 2012, Google saw online marketing tools growing more and more sophisticated. But as their sophistication evolved, the need for tags increased to make these tools effective. Though tags provide online marketers with beneficial information, tags can also overburden your website and become too confusing to manage.

    So Google developed Google Tag Manager, a tool that allows online marketers to consolidate all their tags into a single strand of code and gives them the ability to manage their tags through a user-friendly web interface.

    Now that we know what a tag and Google Tag Manager are, why should you use Google’s tool?

    14741920698_c97a07563f_o

    1. Faster Website Load Times

    Too many tags on your website can slow it to a halt. This has a negative impact on your Google ranking because load times are one of the parameters Google takes into account. With Google Tag Manager, you are allowed to specify when you want a tag to be triggered, which means not all your tags will load at the same time. This increases your website’s performance speed, which makes both your users and Google happy.

    2. Easy-to-Use Tag Template

    With Google Tag Manager, it’s no longer necessary to call up the IT guy every time you need to add a tag to your web interface. Tag Manager eliminates the need to add the code snippet to your website’s source code by introducing an easy-to-use template. This template allows users to quickly add tags for AdWords conversion tracking, Google analytics, GDN remarketing, and more. Tag Manager also supports custom tags.

    3. Error Prevention

    In the world of online marketing, there’s nothing worse than trying to add a feature to your website and causing the website to crash instead. Google Tag Manager prevents this by giving users a preview mode, a debug tool, and access to the version history. These tools show users how proposed changes will affect their sites before the changes go live.

    4. Customizable Permissions

    Another way Google Tag Manager adds to efficiency is by allowing the account admin to delegate access to the tool amongst a variety of users. This means that more than one person can add tags to your website. This feature is essential for projects that involve a lot of collaboration, since you no longer have to worry about giving a third party complete access to your website so they can update your source code. You can give or limit access to the main account as much as you want.

    5. Reduced Costs

    Of course, the best part about being able to manage your tags and increasing your efficiency is the amount of money you save by doing so. Google Tag Manager is a free tool, and by using the wealth of resources at your disposal to learn how it works, you’ll be able to add and customize your tags like a system administrator in no time. Instead of messing around with your source code and picking up the shambles when it all falls apart, you’ll be able to work on what draws people best to your website: creating fantastic and informative content.

    Do you currently use Google Tag Manager? Let us know how it’s working for your website.

  • How to Win Leads and Influence Potential Customers with LeadSNDR

    1603-SI-TheInfluencer-KL-A-03-lg

    Depending on your business, lead generation can be one of the most, if not the most, important performance indicator for your marketing efforts. Regardless of the medium (online, billboards, radio, etc.), a critical part of lead generation is asking yourself: How do you want to receive leads?

    At Search Influence, our CEO has a saying: “Do you want your door to swing, your email to ding, or your phone to ring?” Choosing the method of lead generation that works best for your business is the first step towards gaining qualified leads.

    Between the three, tracking the success of lead generation through emails and calls is typically more reliable than foot traffic. Unless you ask each customer who walks in the door how they heard about you, it’s unlikely you’ll be able to gather measurable results over time. In our experience, we’ve found the greatest success generating and tracking leads by using forms and call tracking through our in-house system, LeadSNDR.

    LeadSNDR logo image

    Lead Generation

    Lead generation marks the conversion of a website browser to a potential customer. By filling out a form or calling you for more information, the person is signifying to you that they are interested in your business and they’re ready to hear what you have to say.

    The methods utilized by LeadSNDR make it easy for that casual website browser to reach out to you, regardless of where they are on your website, so they can convert to a potential customer.

    We use both forms and call tracking to ensure you’re offering site visitors their preferred method of communication to reach out to you. There’s nothing more frustrating than searching a site for an email or phone number when you have a question. It’s more likely that you’ll give up and go to a competitor’s site than spend time searching the site you’re on.

    With LeadSNDR, there is a mini form on each page that asks the minimum basic information required to get back in contact with your potential customer. By putting a form on each page, the site visitor doesn’t have to leave the page they’re on to get in contact with you, which provides a good user experience.

    Contact Us LeadSNDR Image

    We also put a larger form on the contact page with additional fields, in case the visitor wants to send more information, so you’ll be prepared to discuss their specific question when you contact them.

    It’s also important to make it easy for a potential customer to call you. We recommend putting your phone number big and bold in the header of your website so it’s easily visible regardless of which page you’re on, which also provides a good user experience.

    Large Contact Form LeadSNDR

    Lead Tracking

    You know that you want your email to ding and your phone to ring, you’re ready to put your number in the header of your site and forms on every page, but what do you want to know from your potential customers? You’ll likely want the basics like their name and how to get ahold of them, but what about the actual information you’re asking?

    The LeadSNDR form system is designed to suit the specific needs of your business with the ability to completely customize your form. You can specify everything from the colors and button text to the questions you’re asking your potential customers.

    Quick Reservation Form LeadSNDR Small Contact Form LeadSNDR

    Another key factor of the forms is the ability to gather information that is not asked of the customer but still valuable to tracking your leads. By integrating LeadSNDR with Google Analytics, you can see which search engine was used, if the user clicked on a paid ad or organic results, what page the user landed on, and even the IP address. This information allows you to examine trends and make informed decisions about improvements to your website to create more lead generation through form fills.

    For call tracking, it’s not only important to make it easy for a potential customer to call you, but also to know how they got to your site. LeadSNDR allows you to set up specific call tracking for numerous sources, which means that phone calls are catalogued by how a visitor arrived on your site. With call tracking, you can differentiate the amount of calls received from a Facebook post from calls received by Google organic search.

    The reporting system used in conjunction with LeadSNDR also gives you the data on the amount of calls you receive each month, their duration, the average number of rings before answered, and more. You’re also given the option to record calls to conduct quality assurance testing.

    Using LeadSNDR for Your Business

    By combining lead generation with tracking, you will be able to drive quality leads to communicate directly with your business and measure trends to set you up for future successes. LeadSNDR provides your business with the tools it needs measure the performance of your marketing efforts and convert site visitors to customers.

    For more information about LeadSNDR and how to increase your business’s leads, please contact us today.

  • The Top 6 Metrics You Should Be Tracking in 2016, As Explained By Cats

    According to Facebook, 1.01 billion people log on to the social platform daily. Google sees impressive traffic as well, with 3 billion search queries per day…and that’s just the tip of the iceberg.

    Everyone is online these days. So it’s no surprise that online marketing has become increasingly more important to the modern business. But how do you know if your campaign is working? First, you might want to check out this Search Influence blog on what Google Analytics is and how to set it up for your site.

    After you’ve got your analytics set up, what exactly should you measure? And what does it mean?

    Here are the six metrics you should be measuring in 2016 as explained by cats. Note: screenshots are from analytics on my own personal site, which was set up pretty recently and has no online marketing campaigns associated with it.

    1. How many people are actually coming to your site?

    Just because you build it doesn’t mean they will come. Measuring unique site visitors can give you big-picture insight into how well your campaign is performing.

    SI Blog Post - 2-8-2016 - Shaye Anderson

    2. What device are they using?

    Were they on a desktop computer or phone?

    Knowing which device people are using when they look at your site can direct you to present the most useful information in the most useful way. For instance, if someone is on their phone looking for contact information and hours of operation, it would be helpful to have a click-to-call phone number front and center. Or a button that says “Call!”

    You can also get as specific as screen resolution. This is especially helpful when dealing with any kind of graphic or visual representation on your site. Your information won’t be very helpful if people can’t even read it!

    SI Blog Post - 2-8-2016 - Shaye Anderson (1)

    SI Blog Post - 2-8-2016 - Shaye Anderson (2)

    3. Are they sticking around?

    It’s simple enough: if visitors find a page unhelpful, irrelevant, or hard to read, they’ll go elsewhere. When a visitor comes to your site and immediately leaves, that’s called “bouncing.” You should measure each page’s bounce rate to make sure you are sending out the right signals, delivering the right information, and providing clear content. So how do you know you’re in the green?

    “One thing that’s important is to be realistic about expectations with your bounce rate. High bounce rates are expected for certain pages (especially conversion capture points, such as checkout pages following a purchase) or on information-heavy landing pages. In these instances, high bounce rates can be taken to mean that the visitor came to your site, got what they wanted, and left. For average pages, an “average” bounce rate is much more preferable. It’s also important to be wary of very low bounce rates approaching or at 0%. This could be indicative of incorrectly installed Google Analytics and represents muddying of your data.” – Leigh Aucoin, Lead Web Developer at Search Influence

    SI Blog Post - 2-8-2016 - Shaye Anderson (3)

    4. How long are they staying?

    Building off of #3, you obviously don’t want people to bounce; you want them to look around your site and convert (more on that in #5). So how long are they actually sticking around on your site? Short or long time-on-site can be good or bad, depending on the purpose of your site, what people are looking for, and how extensive the information is on your site.

    For instance, it’s reasonable that someone researching plastic surgery would spend a long time reading information about the procedure they are interested in. Also, it might make sense for an online visitor to spend a long time on an ecommerce site; they might buy more! But if someone is just looking for quick information—a phone number or hours of operation—it’s bad news if they need to spend a long time to find it!

    SI Blog Post - 2-8-2016 - Shaye Anderson (4)

    5. Are they converting?

    “Conversions” can mean many things, it really depends on your unique campaign and the specific page. A conversion could mean that a visitor fills out a form, makes a purchase, or calls a number.

    “Be aware of your business and what matters to you as a business, and how it’s made present on your site. If you sell items online, of course you’d like to track what led users to a purchase (a conversion in a more general sense). However, if you don’t sell items directly on your website, a form contact can be the next best measurement of a conversion. This means that you’ve been placed into contact with a potential customer. Ultimately, Google Analytics is a tool by which you can track any actions that a visitor to your site takes on your site and what leads them to do what they do.” – Leigh Aucoin, Lead Web Developer at Search Influence

    Search Influence has our own service called LeadSendr where we track conversions through a form on your site. You can find more information about that here.

    6. Are you seeing a return on investment?

    All these metrics are great, but they don’t mean much if you’re not seeing a return on investment. You want to make sure that your online marketing campaign works in tandem with your larger marketing goals, driving more customers to your business!

    All these metrics are great, but they shouldn’t be used in a one-and-done fashion. Use Google Analytics to check the success of your campaign efforts and then adjust your approach. A marketing campaign should be ever evolving. Using the metrics, you can learn from past mistakes and continuously improve your methods.

    Not sure where to get started with your site?

    Sit back, relax, watch this calming cat GIF, and let our team of experts craft a campaign that meets your business’ unique needs. What’s more, we track all the metrics for you! This way, you can worry about what matters most: your business!

    GIF Credits:

    Cats at Work
    Shark Cat
    Slipping Cat
    Cat in Box
    Cat Breaking Glass
    Money Glasses Cat
    Dancing Cat Graphic

  • SEO 101: How to Install Google Analytics on Your Website

    Blog1

    So you want to take your business to the next level. You built this amazing website, but you have no idea if anyone is even looking at it. You’ve looked around online and found a pretty cool stat counter, but you need more information than that. That’s where Google Analytics comes in.

    What Is Google Analytics?

    Google Analytics is a robust tool used to track visitors to your site and how they arrived there—and it’s absolutely free. With Google Analytics, you can track how many visitors have viewed your website, what pages they viewed, how long they stayed on your website, and a lot more. You can even figure out where in your conversion process visitors are most likely to abandon the conversion. This kind of information is essential for truly optimizing your website to appeal to your visitors.

    Hopefully, I’ve sold you on Google Analytics, but before we can glimpse any of those sweet, sweet metrics, we have to install it on your website.

    Step 1: Sign up for an account.
    Navigate to the Google Analytics homepage and select Google Analytics from the “Log In” dropdown. Then select “Sign Up” on the following page.

    Step 2: Fill out information about your website.
    Provide Google with basic information about your website, including its name and location. After filling out this information, accept the terms the conditions, and we’re almost there!

    New Google Analytics Account, Login Screen Image

    Step 3: Copy and paste the Google-provided JavaScript snippet onto your website.
    Make sure you implement the JavaScript snippet so it appears once per page on every page of your website. This is important to make sure we track all users on your website accurately. If you are using a templated website, it is best to insert the snippet above the closing </head> tag.

    JavaScript Snippet For Google Analytics Image

    Step 4: Filter all your internal traffic.
    You don’t want the pageviews to your website to be skewed by your own visits to your site. That’s why it is important to create a filter that removes any visits from your IP address. You can easily find out what your network’s IP address by clicking on this link. Copy your IP address and navigate to the Admin section of your Google Analytics account. In the rightmost column, select “Filters” and add a new filter titled “Filter Internal Traffic,” as in the image below. Click save, and you’re all set!

    Filter internal traffic for Google Analytics image

    Get tracking!

  • What’s Black and White and Impacts 3-5% of Search Queries? Panda 4.1!

    In the last two months, Google has been busy improving the Panda. In early August (Aug. 8, 2014, to be exact), there was a lot of chatter from the SEO community seeing the flux in Google Analytics accounts, which was generally accepted as an unconfirmed monthly Panda data refresh.

    In early September, there was a large Panda data refresh, and on Sept. 25, Google’s Pierre Far announced yet another Panda algorithm update, (the previous Panda algo update was May 19).

    GooglePlusPostPandaAnnoucedImage

    And just to keep you on edge, ceaselessly examining your Analytics data, the rollout of this Panda has been sloooowwwwslothlike. Google confirmed that some Google data centers were not updated until “October 6 or later.” So, your website could have seen the algorithm at some point before Sept. 25 and after Oct. 6 – that’s a two-week time frame to analyze!

    What is Panda?

    There are so many blog posts out there describing the Panda algorithm, I will just summarize it briefly. If you’re interested in reading about it in more detail, here’s a good blog post, and some excellent reading here.

    Panda is an algorithm that filters the search results to:

    1. Reward high-quality content with more presence
    2. Push sites with thin content down to rank lower

    Google says low quality or thin content is text that

    •   Is very short in length
    •   Offers very little useful information to the consumer
    •   Is unoriginal or copied

    Your website content should not be self-serving; it’s all about providing information to the consumer to educate them with detailed and authoritative information.

    PandaContentPullQuoteImage

    This most recent Panda is an algorithm update, which is supposed to reward more high-quality small and medium-sized websites. From Par’s G+ post:

    “Based on user (and webmaster!) feedback, we’ve been able to discover a few more signals to help Panda identify low-quality content more precisely. This results in a greater diversity of high-quality small- and medium-sized sites ranking higher, which is nice.”

    This update is significant because it added more signals to better identify lower quality sites. Earlier algo updates have rewarded big directories for local searches, so this update is exciting because small- and medium-sized websites have a fighting chance for ranking in their local markets.

    Google Updates vs Data Refreshes

    To paraphrase, an update is a change in the algorithm. A data refresh is when the algorithm has not changed, and new data that is pushed through the data centers, such as new crawl data, is updated in the various data centers across the Google universe.

    Updating the data centers is one reason why updates are seen at different times for different geographies.

    I am quoting this really old Matt Cutts blog post here:

    Algorithm update: Typically yields changes in the search results on the larger end of the spectrum. Algorithms can change at any time, but noticeable changes tend to be less frequent.

    Data refresh: When data is refreshed within an existing algorithm. Changes are typically toward the less-impactful end of the spectrum, and are often so small that people don’t even notice. One of the smallest types of data refreshes is an:

    Index update: When new indexing data is pushed out to data centers. From the summer of 2000 to the summer of 2003, index updates tended to happen about once a month. The resulting changes were called the Google Dance.”

    What are data centers? Google crawls the websites out there and caches those in their gigantic index. That index is huge and is stored on thousands of machines. Those thousands of machines live in various Google data centers around the world. To truly geek out, read more about Google data centers here – these centers are where the Internet exists.

    Did Panda Help or Hurt Your Site?

    When you look in Google Analytics, it may be easy to see a drop off or dramatic increase. For example in the graphic below, I’m guessing Panda rolled out in the business’ local area around Oct. 6, and it didn’t go well for the site:

    Panda rolled out Oct 6, 2014

    And on Sept. 29, this site was Panda-happy:

    increase in Google organic traffic after Panda September 2014

    For most of the sites I looked at, the visual changes were more subtle, so I usually toggle between the data by week vs. the daily data. The weekly data shows me a week where the decreases started, which correlates to the earlier rollout dates:

    weekly analytics view to pinpoint Panda rollout

    When I switch to the daily data, I can clearly see the dips in traffic. I have to pinpoint Saturday, Sept. 20t or Wednesday, Sept. 24 as the day this site got the Panda.

    daily Analytics shows dips in Google organic traffic after Panda

    The Sept. 20 might be a little early to fit in the Panda time frame, and I am accustomed to seeing a spike immediately before an algo filter, so I’m going for Sept. 24. Using Sept. 24 as the before and after date, this website has seen 12% decrease in Google organic traffic.

    12% decrease in Google organic traffic after Panda Sept 2014

    This website with the 12% decrease in Google organic traffic after Panda is a good website for an authoritative local business. What this drop tells us is even if the content on the site offers really great information for the consumer as this one does, it might be old and/or thin. Someone may have copied it over the years. We might need to add other content to our pages with images and videos. Content is not just text. We need to take a good look at the age of the text and the variety of the content on the page. With this review, we can create a strategy for improving the content for the next Panda data refresh.

    What to Do Now

    PandaImageWebsite owners or managers who see a Panda smack really need to take a critical look at the content on the site. To succeed, the content needs to be information rich, and not self-serving.

    An example of self-serving content is content that is stuffed with keywords, abundant keyword use on a page not only in the body text, but also in the URL and alt tags. This is also sometimes referred to as over-optimization.

    Self-serving can also mean the content talks too much about the business instead of talking about the product or service the consumer is trying to learn about. Talking about the business is great as long as it’s on the About page or the home page. Leave products or service pages to be about those topics.

    This is a great list compiled by Josh Bachynski “The Complete Google Leaked PANDA Do & Don’t LIST – 2011 to Present.”  This list really dives into the aspects of good and not-so-good content.

    Google published a list of questions to ask when writing content. The full list is here. I have chosen some to republish below:

    • Would you trust the information presented in this article?
    • Is this article written by an expert or enthusiast who knows the topic well, or is it more shallow in nature?
    • Are the topics driven by genuine interests of readers of the site, or does the site generate content by attempting to guess what might rank well in search engines?
    • Does the article describe both sides of a story?
    • Does this article provide a complete or comprehensive description of the topic?
    • Are the pages produced with great care and attention to detail vs. less attention to detail?

    Diversity of content and freshness of content are also factors to consider.

    Diversity of content helps readers in various ways. Content can mean images. Original images are best rather than stock images, but stock images work. Content can also mean videos, charts, calculators, and reviews. Content is anything that helps the consumer learn more to make well-informed decisions.

    For content freshness, a blog is probably the easiest approach to keep the website updated regularly without having to rewrite your page’s content too often.

    If you have a specific owner or practitioner who is the authority on the information, claim that using Author markup – authorship thumbnails are gone from SERPs but that doesn’t mean the Author authority is gone.

    There are so many tactics for coming back after a Panda smack, and the best strategy is a mix of tactics. It will likely take time to create really good content and build back your website credibility, but it is a necessary investment for your site’s success.

    If you think your site is suffering from the Panda, give us a call. We would be glad to help.

  • Getting Hands On With The New Google My Business

    Today, Google launched Google My Business. This new, more intuitive Google Places serves as a one stop shop for small businesses to do the normal Google Places work like updating business info, adding photos, connecting with customers through Google Plus posting, and staying on top of reviews. They also launched an Android app for managing Business Tools on the go (with the promise of an iOS app launching soon). Watch Google’s introductory video to Google My Business here.

    Changes For Users New and Old

    All new businesses to Google will start in Google My Business. As for current Google Places users, a blog post from Google earlier today said, “We’re also upgrading current users of Places for Business and the Google+ Dashboard to this new experience.” For those who just sat through and are still cleaning up the mess that was the upgrade to the new Google Places, don’t worry! You won’t have to go searching for which dashboard your listings are in or anything like that. It seems that Google My Business is a mostly superficial change that has already happened and just means a newer looking dashboard and a few extra features and controls (like easy access to Youtube, AdWords, and Analytics).

    Google My Business, Game Of Thrones Gif - Search Influence

    Quick & Easy Editing

    These new features are pretty awesome. From your dashboard, first you’ll see the area for easily managing the individual aspects of your primary business information where previously you would have navigated through an “Edit Business Details” button. Connected to the bottom of this dialogue, there will be a blue box that allows you to edit the business information needed to get your profile to 100% complete. Google My Business has succeeded in using minor dashboard edits to make major usability improvements.

    Google My Business Dashboard Image - Search Influence

    Streamlined Sharing

    The next box is a basic G+ Share box for social posting to your business page. Share texts, photos, links, videos, and events easily all from one location. Side note: I recently found out, thanks to a post from Mike Blumenthal, that there is now an easy way to connect your business’ brand page to a location. So, if you have been posting socially from a Google Plus brand page for your business, you can now easily transfer that engagement into your verified local page.

    Google My Business Insights Tool Image - Search Influence  Google My Business Insights Followers Image - Search Influence

    New Data & Graphs

    Next, you’ll find the Insights Tool. Here, you can see how many views your G+ page has gotten over a period of time, how many clicks occurred, and where they went (either looking for Google Maps driving directions or directly to your website). The next feature (and my favorite addition to the Google My Business dashboard) is the reviews section. When you click into “Manage Reviews,” you’ll see your Google reviews as well as other business reviews from around the web. If you click “Analytics” at the top of this page, you can see a really streamlined graphical representation your review information or “Rating Stats” and where your business’ reviews come from.

    Google My Business Reviews Tool Image - Search Influence

    Additional Tools

    You will be able to see other tools like Google Analytics (if you have it installed on your site), YouTube (if you have a channel connected), and AdWords Express (again, if you use it). If you don’t use the above tools, they will still appear at the bottom of your dashboard with the option to “Get Started” if you want to use them! You’ll also see a place to “Join a Google Hangout” at the very bottom of your dashboard. All in all, the new Google My Business looks looks both beautiful and user friendly, presenting a new way to manage businesses’ online reputations through Google.

  • 5 for Friday — Links, Stories, & Posts for Your Weekend

    five1. Google Acquires Waze to Improve Local Search Experience – Brafton

    On June 13, Google announced that it had acquired Waze, a social-sharing platform that uses crowdsourcing to gather real-time information about road closures and traffic jams to give mobile searchers accurate, up-to-the-minute directions. The deal will provide new data for Google Maps that might improve local search capabilities and help fuse online content marketing with in-store sales.


    2. Apple Makes Bing The “Default Search Engine” For Siri – Search Engine Land

    Apple announced this week that when iOS 7 comes out this fall, Siri will have a new integrated web search feature powered by Bing. This update could go a long way toward making the voice activated virtual assistant a better web search option for iPhone users, and could potentially drive a lot of new traffic to Bing.


    3. Twitter Offers Free Analytics For All Users – Search Engine Watch

    New analytics are available on Twitter to help users identify trends in their accounts without having to go to a third-party tool. While the data is basic, it may provide marketers and small businesses with valuable insights into the behavior of their followers.


    4. Marketers See Big Data Analysis As Critical Skill for Success – Marketing Pilgrim

    A recent study shows that the “ability to use data analysis to extract predictive findings from big data” is the most prized skill for a marketer to have. You might be surprised by which skill ranked second. Overall, the list shows that some “old school” skills still have a lot of value.


    5. How to Build Links to Your Blog – A Case Study – Moz

    Proper link building is a key ingredient in developing a successful blog. Paid advertising and social media strategies will only take so far. This author shares the story of how he got the links he needed to get his travel blog out to a wide audience.