Key Insights
- Tracking, reporting, and analyzing are three pillars of a successful higher education advertising strategy.
- From click-through rate to cost per inquiry, several metrics temperature check your paid ad campaign performance.
- Search Influence and UPCEA collaborated to establish the first industry-wide cost per inquiry benchmark to help higher education marketers assess the state of their campaigns.
- Tapping into the right metrics and data sources for your university unlocks insights that best optimize your campaigns.
- When in doubt, partner with an experienced paid advertising agency that is proficient in turning data into decisions.
According to 2023 research from Invoca, 87% of marketers feel that data is their most under-utilized asset.
Like a gym membership, full of promise but often underused, data insights are what lead to the most gains in your higher education marketing campaigns.
But the challenge lies in knowing which numbers matter and where to dig them up.
Today, more universities than ever rely on paid advertising to attract the new tech-savvy adult learner. The global shift to digital marketing has opened doors to new metrics and tracking capabilities, all of which help gauge your campaigns’ success.
If you’re a digital marketer, tracking and reporting on the right metrics ensures you use your resources effectively to reach your goals. Here’s what to know about measuring paid advertising success in higher education — and how an agency can help you uncover the metrics that truly matter.
The Importance of Tracking & Reporting in Paid Advertising
Diligently tracking and analyzing vital metrics empowers your higher education institution to assess the impact of your digital campaigns. By maintaining a vigilant oversight of the performance of your paid advertising initiatives, you gain the ability to:
Understand your audience
Data shows that 71% of consumers expect personalized marketing, and 76% feel frustrated when brands fail to meet this expectation.
Achieving this level of personalization starts with knowing your prospective student. This goes beyond mere demographics, factoring in their aspirations, challenges, and the digital footprints they leave.
Through a deep dive into audience analytics, you can segment your prospective students more effectively, crafting campaigns that address their specific needs and interests.
Whether it’s highlighting flexible scheduling for working adults, showcasing success stories from similar backgrounds, or emphasizing support services for international students, tracking audience insights helps center your messaging around your core audience.
Optimize your campaigns
The digital advertising playing field is dynamic, with campaign performance varying by the minute.
Real-time data analysis plays a critical role in optimizing your campaigns for the best results. It enables you to make immediate adjustments, such as pausing underperforming ads or reallocating the budget to more successful ones, which fosters a cycle of testing, learning, and optimization.
Staying agile and responsive to campaign performance 24/7 through successful tracking keeps your advertising aligned with your marketing goals.
Enhance the return on your investment
The true value of tracking and analysis lies in its ability to reveal not just which channels and campaigns are performing but also why.
By dissecting the elements of successful ads — be it the magic words, compelling visuals, or the right call-to-action — you can fine-tune your approach, guaranteeing every dollar spent is one working towards greater engagement and higher conversions.
In doing so, you’ll demonstrate the value of your marketing campaign in ways you want the most: increased return on your investments.
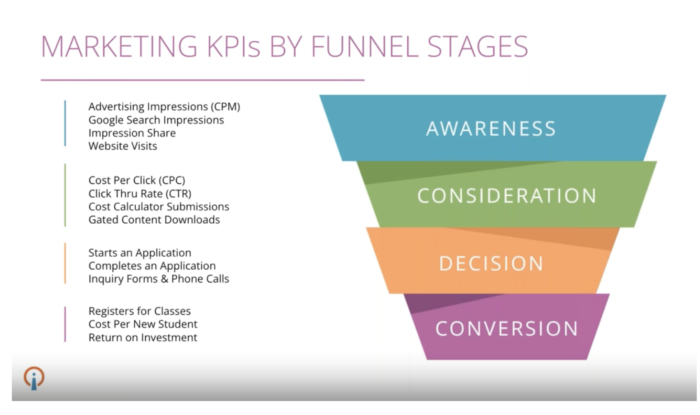
Effective Metrics for Measuring Paid Advertising Success in Higher Education
Tracking the right marketing metrics can make the difference between campaigns that meet the mark and ones that fall flat. The following metrics act as vital signposts, indicating the health and impact of your advertising efforts:
- Click-Through Rate (CTR): gauges the initial appeal of ad copy and visuals, signaling how well your ads grab attention and prompt click
- Conversion Rate: measures the success of those clicks in achieving desired outcomes, like applications, spotlighting how ads translate interest into action
- Return on Ad Spend (ROAS): assesses financial efficiency, comparing campaign costs against generated revenue to quantify your advertising investment’s return
- Cost Per Acquisition (CPA): calculates the average expense of attracting a student via paid ads, offering insights into the cost-effectiveness of marketing strategies
- Engagement Metrics: explores deeper interactions beyond clicks, revealing how compelling and relevant your content is to potential students
Beyond these widely recognized metrics is a critical but often overlooked indicator: Cost per inquiry (CPI).
This metric offers a nuanced view of the investment needed to generate a prospective student’s interest, providing a deeper layer of insight into campaign efficiency and the quality of engagement.
Cost Per Inquiry in Higher Education Marketing
In higher education marketing, CPI measures the financial investment needed to generate a single prospective student’s interest in your offerings, such as your programs, courses, or services.
This metric uncovers exactly what it costs to catch the eye of a potential student, whether they’re signing up on your contact form, reaching out by email, or picking up the phone to learn more.
The “cost” cost component varies based on:
- The specific marketing campaigns
- The mix of marketing channels used
- The capability to track an inquiry back to its origin
By focusing on CPI, your institution can pinpoint the effectiveness of your ad campaigns, guaranteeing that your allocated budget directly contributes to attracting potential students. This helps you achieve a favorable balance between the cost of attracting inquiries and the quality of interest generated.
Benchmarking your CPI against the wider industry
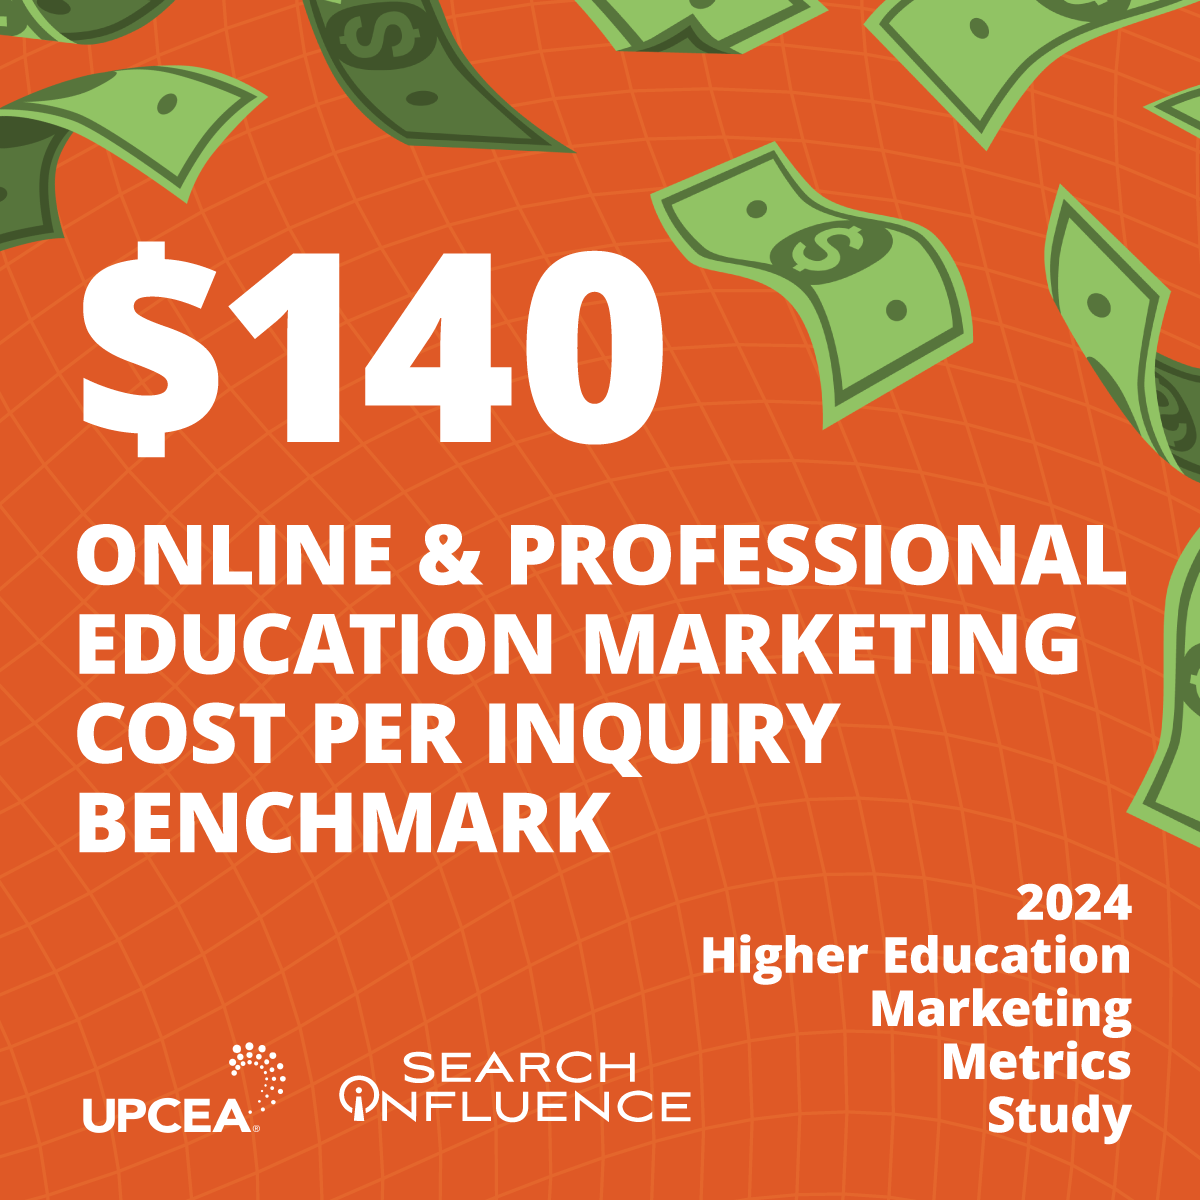
In collaboration with UPCEA, Search Influence established the first industry-wide CPI benchmark to help higher ed marketers like you better assess how you measure up to others in your industry.
Our 2024 Higher Ed Marketing Metrics Research Report revealed that while 73% of marketers track the source of inquiries for their professional, continuing, and online (PCO) programs, less than half (46%) of higher education marketers track CPI.
For those who are tracking this key metric, the average PCO CPI is $140, with a median of $106 and a range of $29.03 – $450.
The research study also unveiled a strong link between metric tracking and satisfaction with results. In fact, 92% of those confident in their tracking abilities also report being satisfied or very satisfied with their marketing campaign performance. This finding reinforces the old adage that “what gets measured gets managed,” emphasizing the importance of diligent tracking in achieving impactful marketing outcomes.
Key Data Sources to Track for Campaign Success
Where you track matters just as much as what you track. At Search Influence, we recommend leaning on the following data sources to keep a steady pulse on your campaign success:
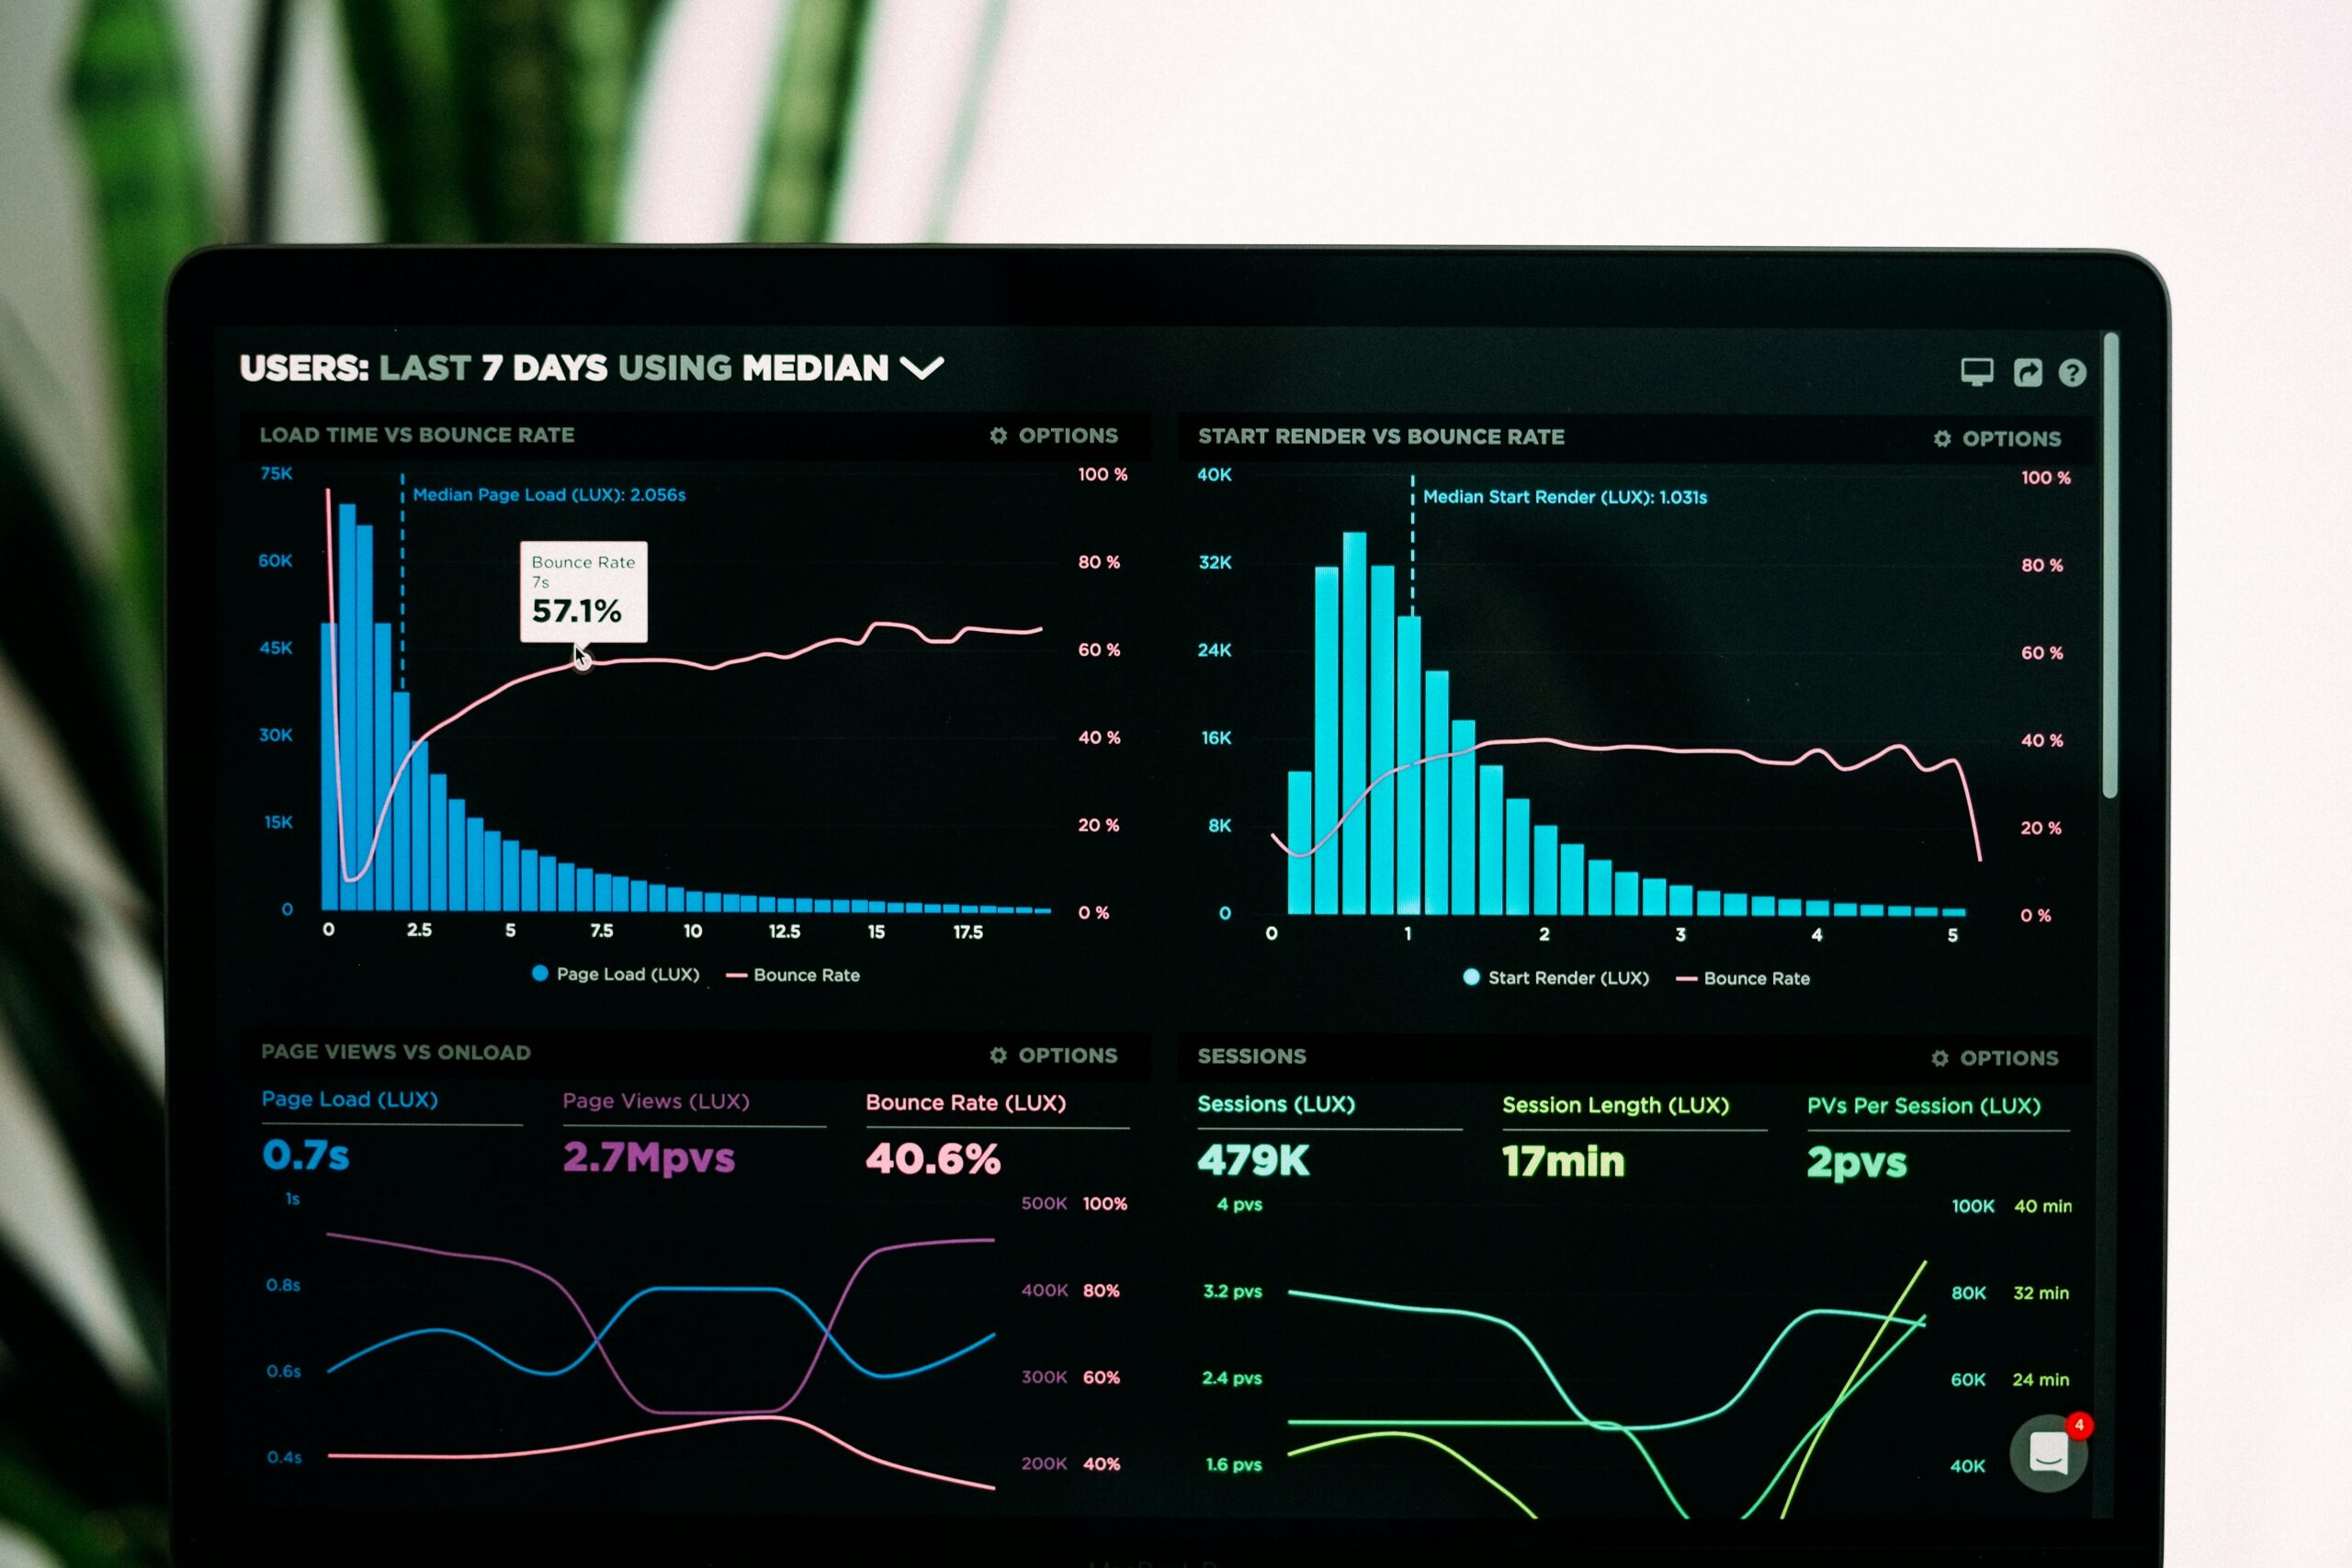
- Website Analytics: Tools like Google Analytics are indispensable for observing how users interact with your site. They offer a window into which paths lead towards inquiry or application and highlight the landing pages that work best.
- CRM Integration: By syncing CRM data with your digital campaigns, you gain a comprehensive view of the prospective student’s journey, from first contact to enrollment, helping to pinpoint effective strategies.
- Social Media Insights: The rich data from social platforms can inform you about engagement levels, reach, and which content types drive actions, allowing for agile strategy adjustments.
- Other Prospect Data Sources: Don’t overlook additional touchpoints like email interactions, webinar participation, or content downloads. These can provide valuable insights into your audience’s preferences and behaviors.
Tracking cost per inquiry
Cost per inquiry is a more individualized KPI, with extra flexibility in how you can measure it to best fit your institution.
Most marketers track CPI as a KPI for:
- Specific Digital Marketing Channels: Differentiated CPI from paid search, organic search, etc., for precise adjustments to strategy and budget
- All-Platform Digital Marketing Spend: Comprehensive CPI across all digital channels to understand the overall budget impact and guide comprehensive financial strategies
However, some marketers may find it more fitting to track:
CPI Per Program: Segmented CPI analysis for individual academic programs to enable targeted marketing enhancements
Organic CPI: CPI exclusively from organic search to refine SEO and content tactics
Overall CPI Across All Marketing Expenses: CPI from all marketing activities for a global perspective on investment efficiency
Whichever way you look at CPI, it’s a versatile metric designed to suit the distinct objectives of your institution and unveil whether your marketing dollars are spent wisely.
Maximizing Results Through Agency Partnerships
Struggling to keep track of your paid campaign’s success? Partnering with an experienced advertising agency can help take the weight off your shoulders.
With an agency’s robust tracking, reporting, and analysis capabilities, you’ll be equipped with the insights needed to make informed decisions and refine your strategies. You’ll gain the advantage of knowing:
- Precisely what to measure
- How to tailor your optimization efforts
- The best ways to integrate these insights into your campaigns for enhanced performance
Agencies are data specialists. They know how to interpret your school’s results, provide actionable next steps, and ensure your strategy always aligns with the latest industry and software changes.
Are You Tracking the Right Metrics?

At Search Influence, we pride ourselves on our ability to obtain results, track them, and report them back to your institution.
We’re here to eliminate the guesswork from tracking the essential metrics that propel your success forward. To get you started, we’ve crafted a comprehensive, free worksheet designed to simplify the calculation of your CPI.
Need more context on how you measure up to competitors? Download our 2024 Higher Ed Marketing Metrics Research Report to gain a clearer picture of your standing in the industry.
Images Courtesy of Luke Chesser and Towfiqu Barbhuiya